- USD/INR drops to seven-day low after breaking three-week-old ascending trend-channel.
- The yearly low lures sellers, buyers will find it tough to cross 61.8% Fibonacci retracement.
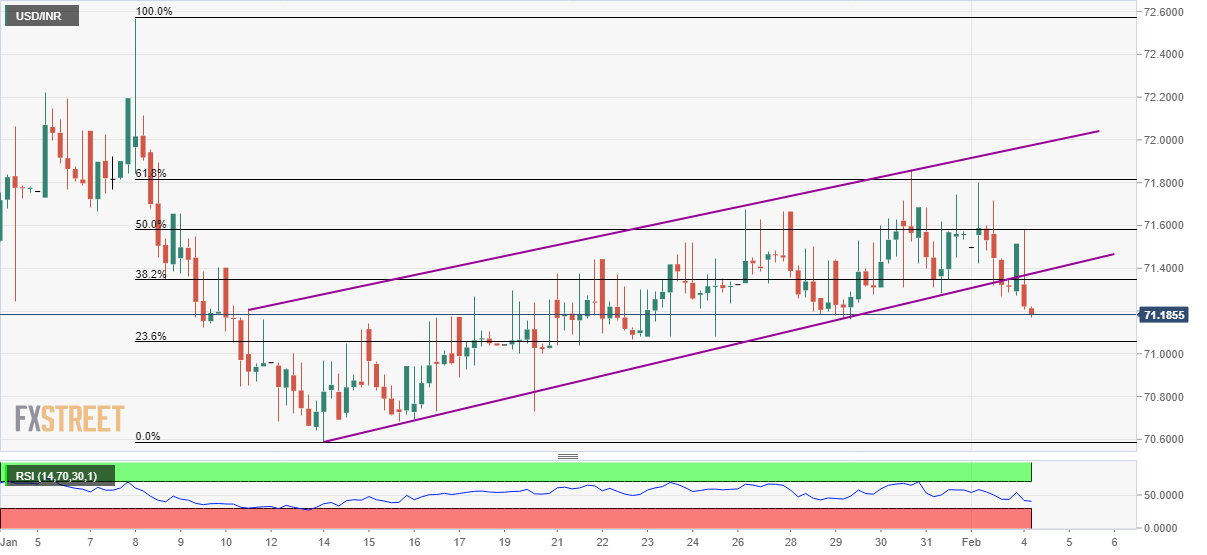
USD/INR drops 0.16 to 71.17 during the pre-European session on Tuesday. That said, the pair recently broke an upward sloping trend channel formation established since January 10.
Prices are now declining towards 23.6% Fibonacci retracement of the pair’s January 08-14 fall, at 71.06, while 71.00 could offer rest to the pair bears.
Following the pair’s downside below 71.00, the yearly low near 70.60 and 70.00 seem to gain the market’s attention.
Alternatively, the pair’s bounce off the support-turned-resistance, at 71.40 now, will push the quote towards 50% and 61.8% Fibonacci retracements, around 71.60 and 71.80 respectively.
However, the pair’s advances past-71.80 seem doubtful, which if happens could take aim at the yearly top near 72.60.
USD/INR four-hour chart
Trend: Bearish
