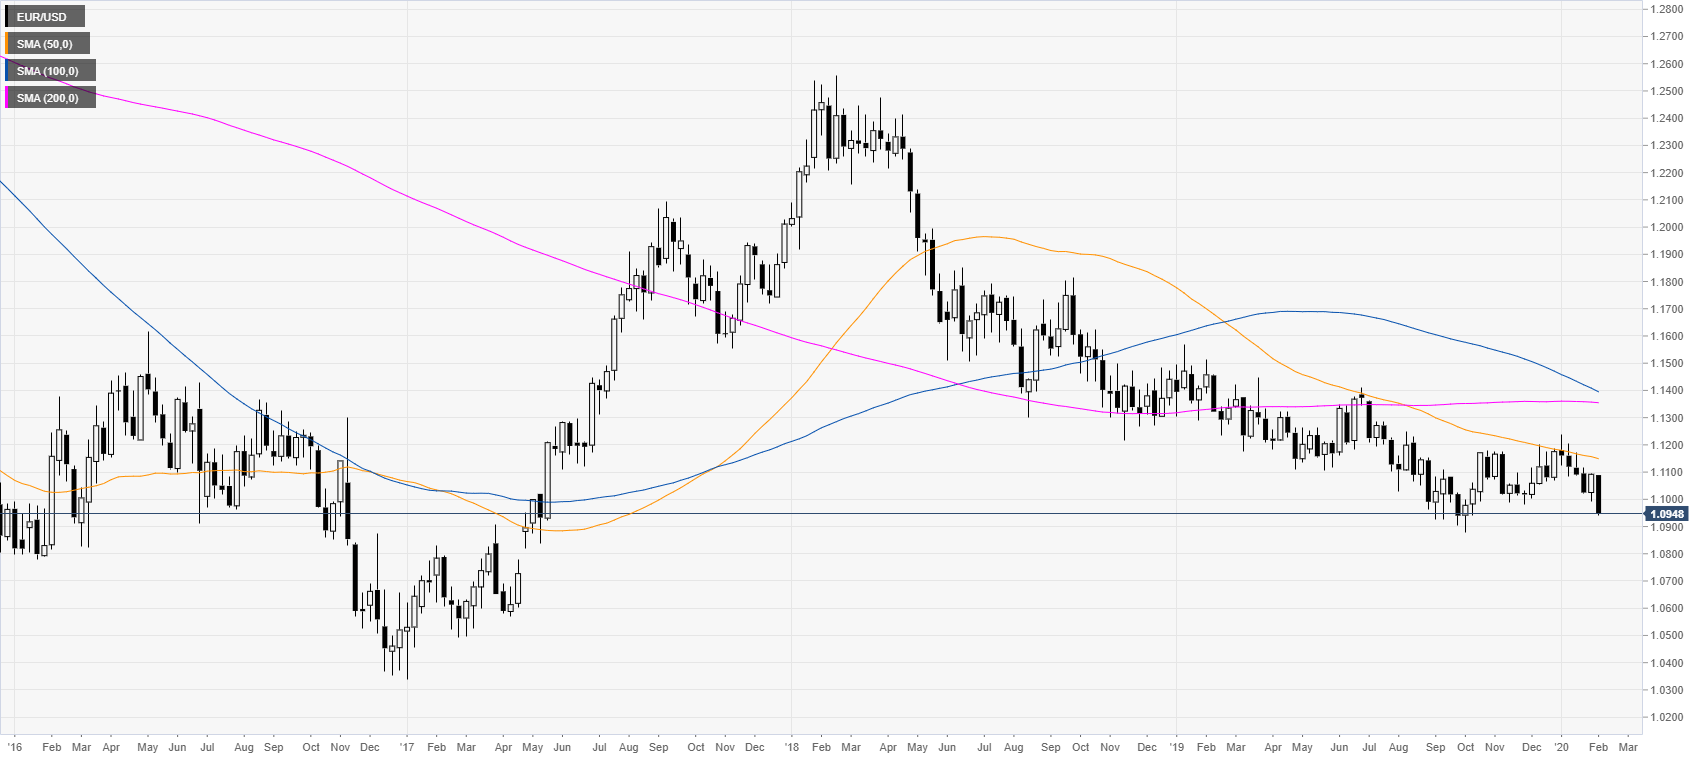
- EUR/USD registers its worst weekly decline in three months.
- Downside targets can be located near the 1.0912 and 1.0877 levels.
EUR/USD weekly chart
EUR/USD is trading below its main weekly simple moving averages (SMAs) suggesting a bearish bias in the long term. The euro had its worst weekly decline since November 2019.
EUR/USD daily chart
The euro is trading in a weak downtrend below the main simple moving averages (SMAs) as the spot is melting to levels not seen since October 2019. This Friday the Non-farm payrolls revealed that the US added 225K jobs vs. 160K forecast by analysts.
EUR/USD four-hour chart
EUR/USD is trading in a downward channel below its main SMAs while sellers are looking for a break below the 1.0930 support. As the spot stays under strong selling pressure, a break below the above-mentioned level is likely to lead to further declines towards the 1.0912 and 1.0877 levels, according to the Technical Confluences Indicator. Resistances are seen near 1.0964, 1.0980 and the 1.1000 figure.
Resistance: 1.0964, 1.0980, 1.1000
Support: 1.0930, 1.0912, 1.0877
Additional key levels


