- GBP/USD is under heavy selling pressure in the lower end of its recent range.
- The level to beat for bears is the 1.2938 support.
- The US Non-farm Payrolls (NFP) is coming up next in line on the macroeconomic front.
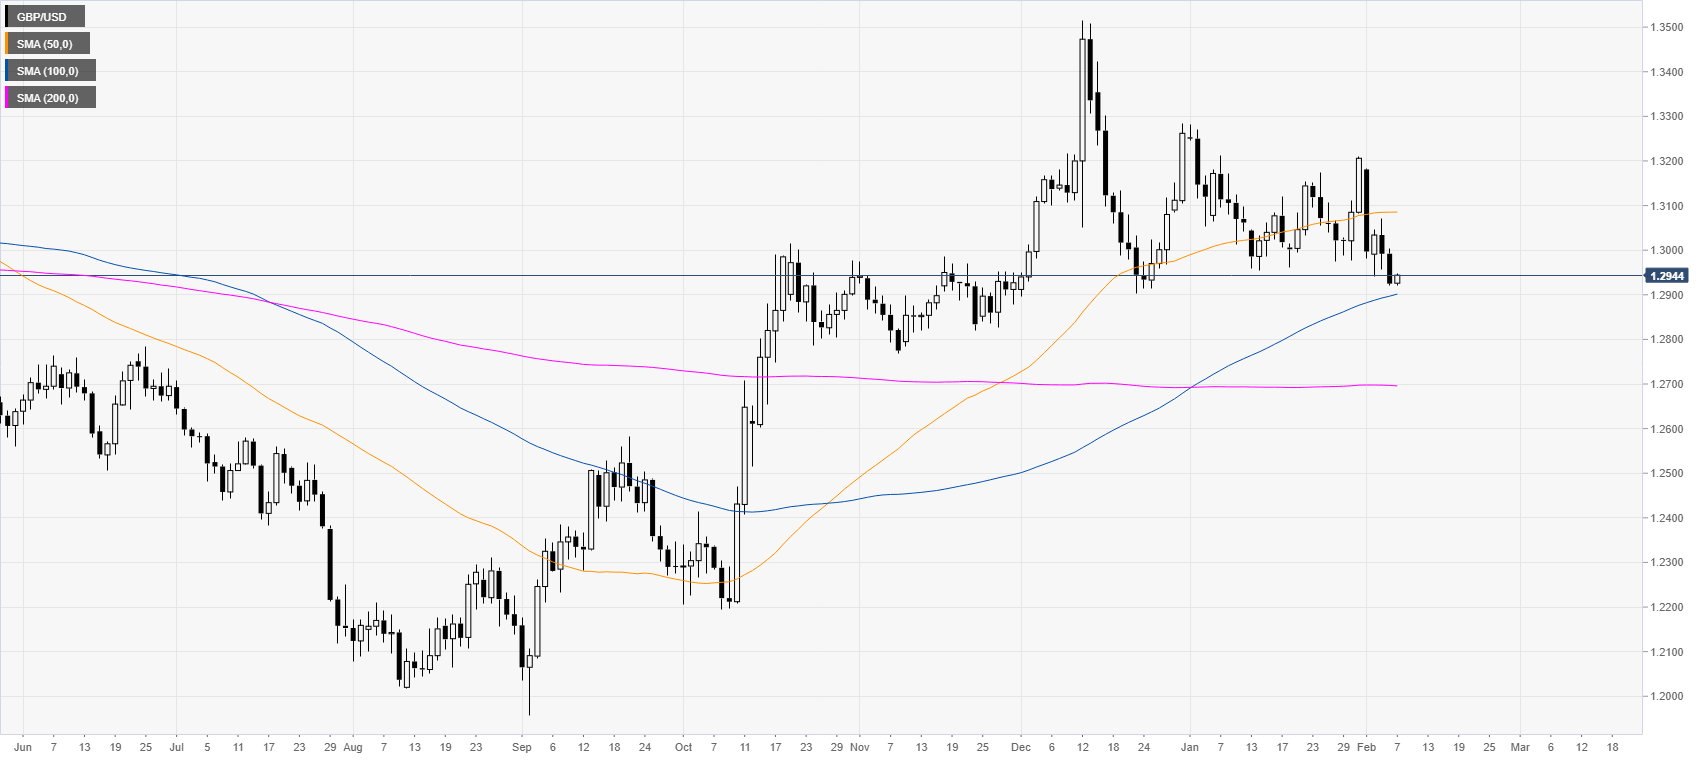
GBP/USD daily chart
Following the October and December bullish-runs, GBP/USD is trading in a rectangle consolidation above its 100/200-day simple moving averages (SMAs). The NFP at 13:30 GMT can lead to high volatility in USD-related currency pairs.
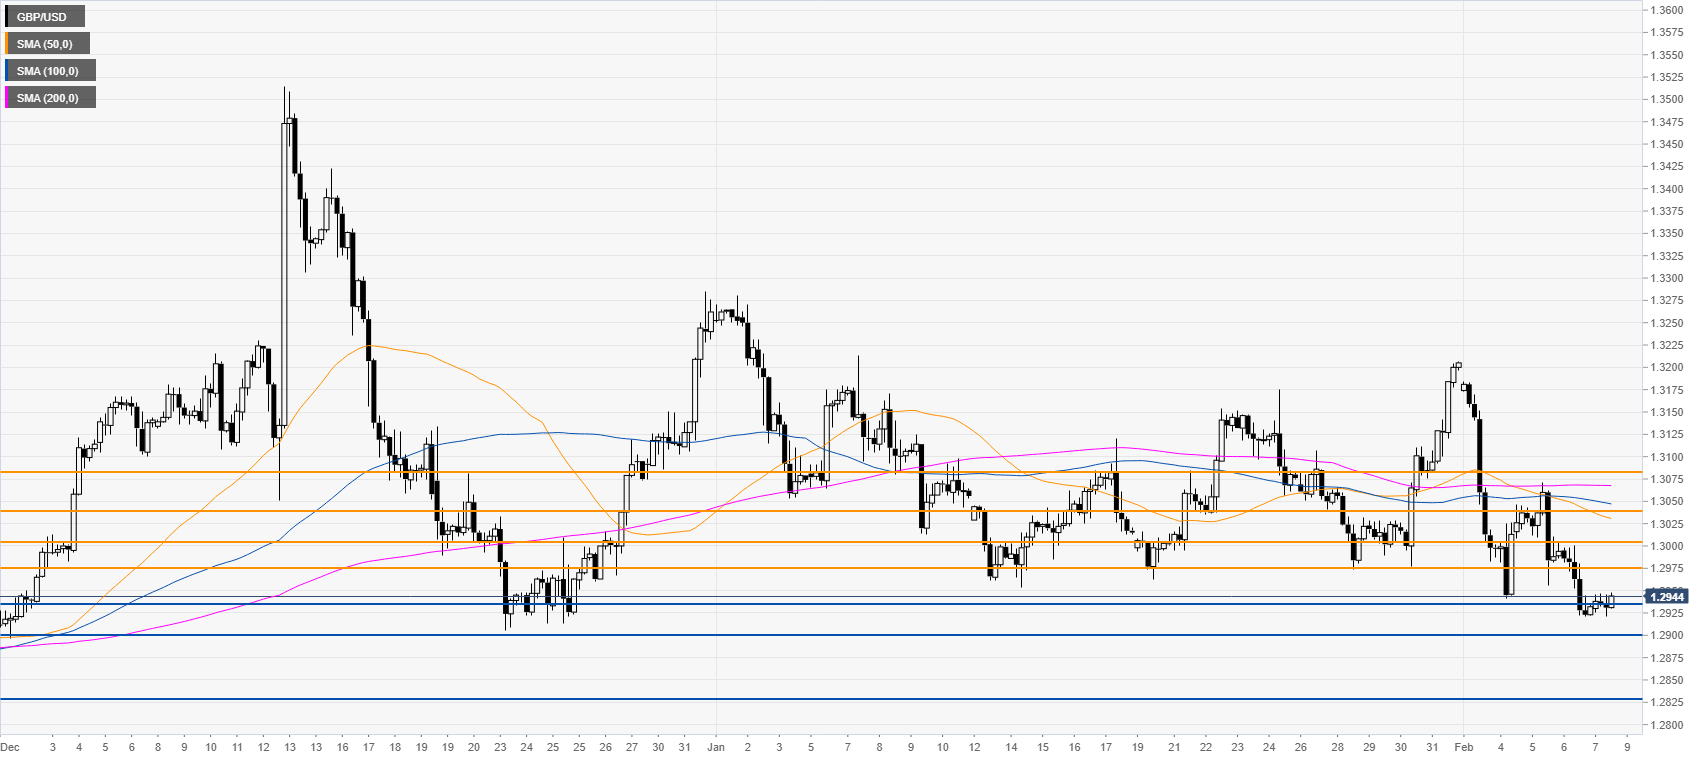
GBP/USD four-hour chart
GBP/USD is under bearish pressure as the spot is trying to break the 1.2938 support. A break below the above-mentioned level should lead to continued weakness towards the 1.2900 figure and the 1.2829 level. Resistances are seen at the 1.2972 level and 1.3000 figure, according to the Technical Confluences Indicator.
Resistance: 1.2972, 1.3000, 1.3040
Support: 1.2938, 1.2900, 1.2829
Additional key levels


