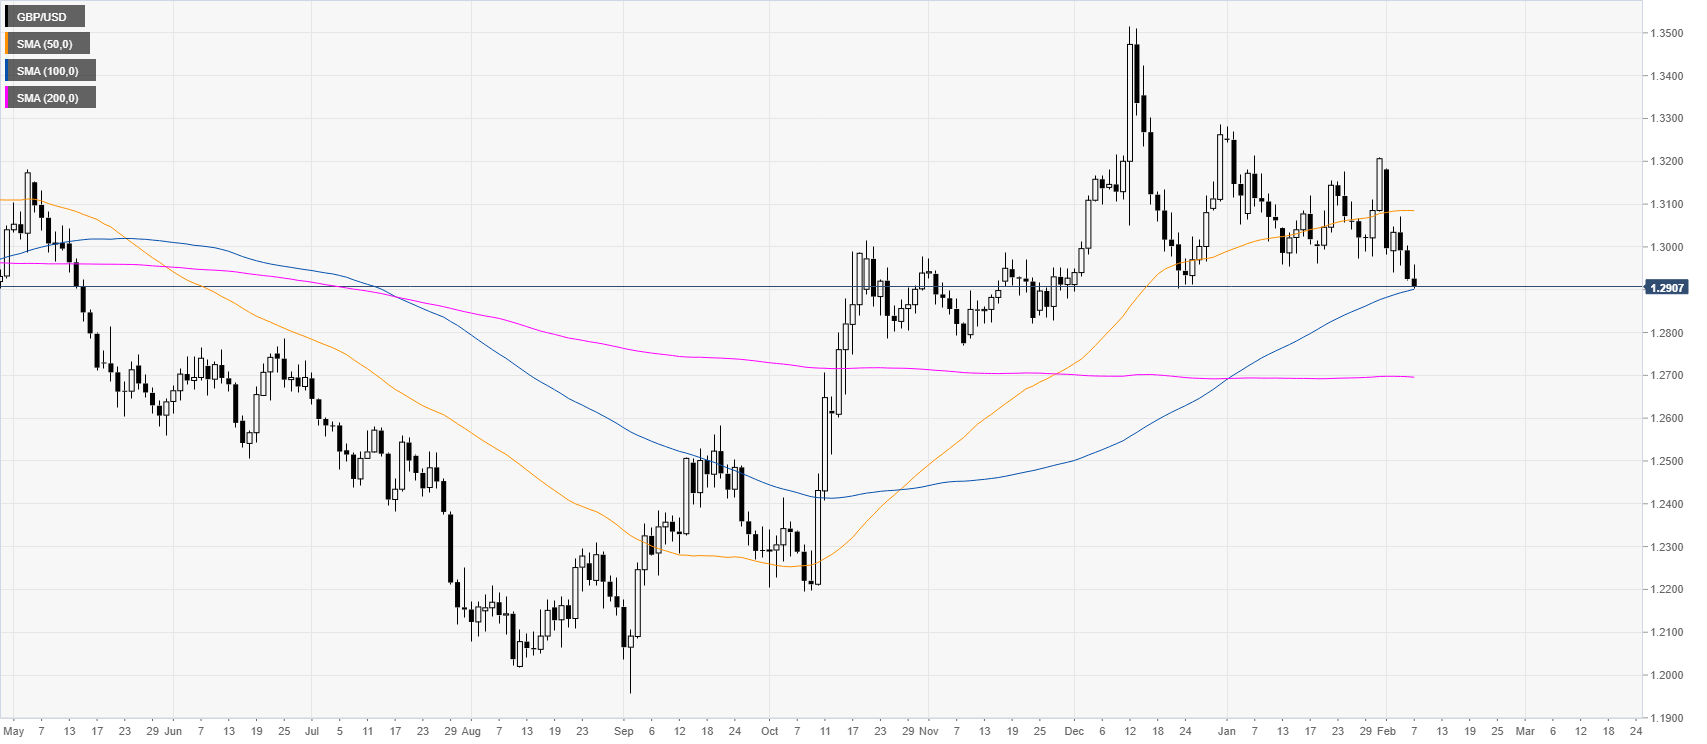
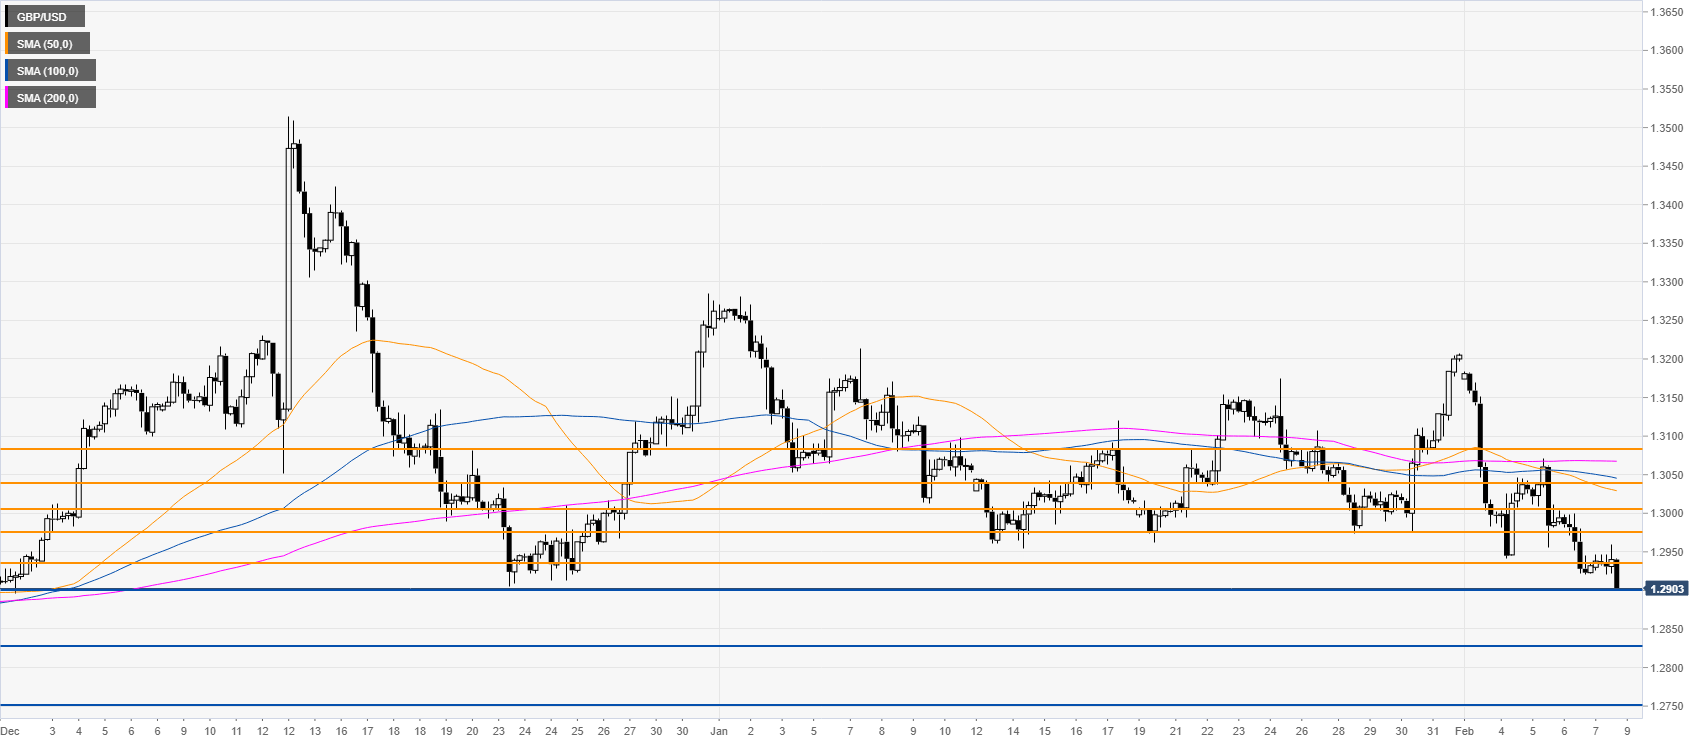
- GBP/USD is under heavy bearish pressure challenging the December lows.
- The level to beat for bears is the 1.2900 support.
GBP/USD daily chart
After the October and December bullish impulses, GBP/USD is trading in a rectangle consolidation above the 100/200-day simple moving averages (SMAs). The NFP came in better than expected at 225K vs 160K forecast by analysts; giving an extra boost to USD.
GBP/USD four-hour chart
GBP/USD is under bearish pressure as the spot is trying to break the 1.2900 figure. A break below the above-mentioned level can lead to further weakness towards the 1.2829 figure and the 1.2829 level. Resistances are seen near the 1.2938, 1.2972 level and 1.3000 figure, according to the Technical Confluences Indicator.
Resistance: 1.2938, 1.2972, 1.3000
Support: 1.2900, 1.2829, 1.2750
Additional key levels


