- USD/CHF created a rising wedge pattern suggesting potential exhaustion in the medium term.
- The level to beat for bears is the 0.9770 support.
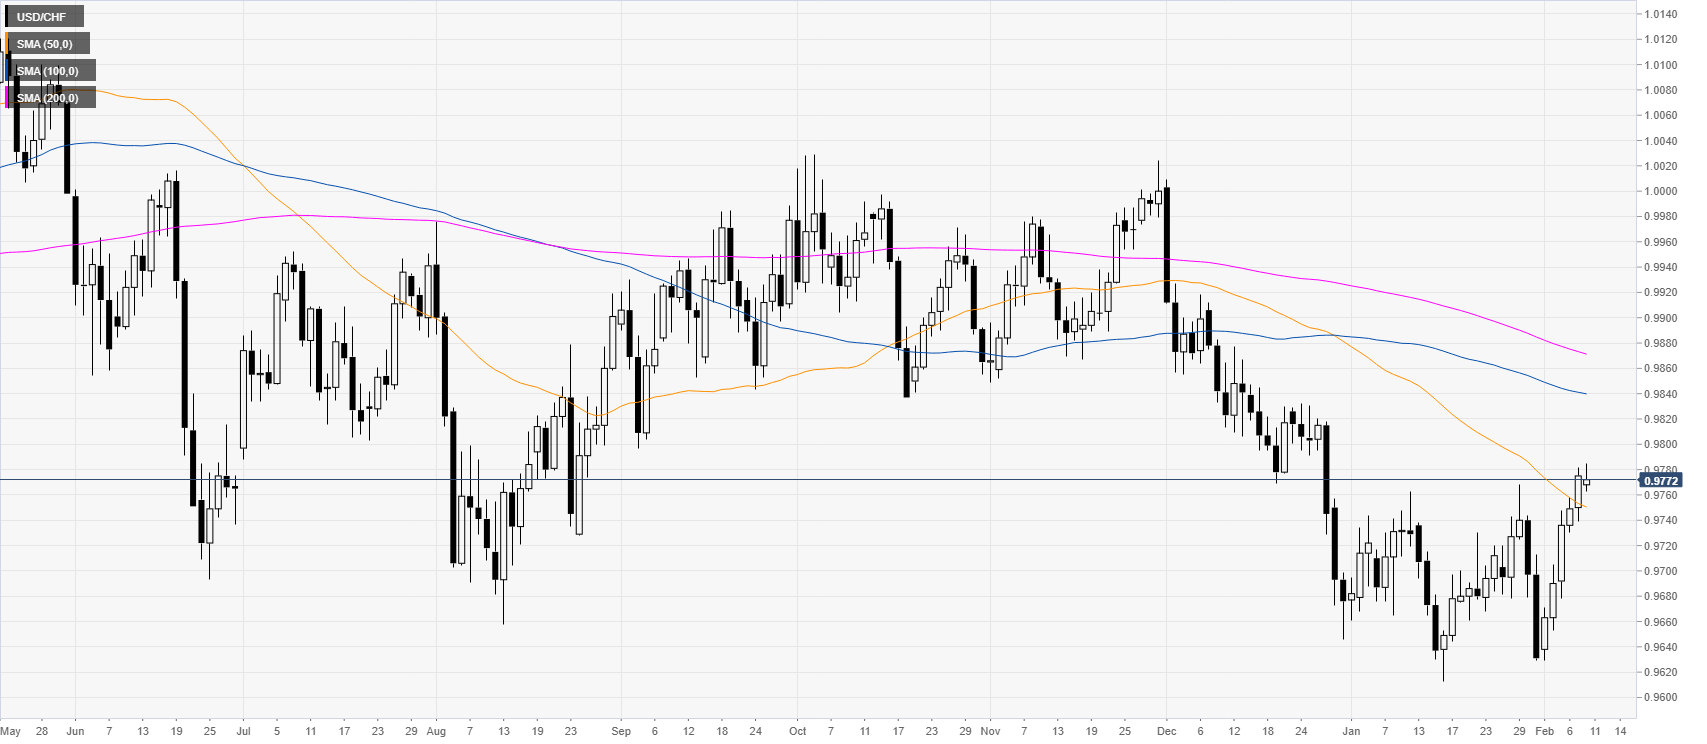
USD/CHF daily chart
USD/CHF is pulling back down slightly from the 2020 highs while reintegrating Friday’s range. The spot is trading below the 100/200-day simple moving averages suggesting an overall bearish bias.
USD/CHF four-hour chart
USD/CHF is trading in a rising wedge pattern suggesting the market might be exhausting itself. If the bears break the 0.9770 support on a daily basis, the spot could decline towards the 0.9730 and 0.9710 price levels. On the flip side, if the buyers surpass the 0.9800 figure the quote could continue trending to the upside towards the 0.9830/50 levels.
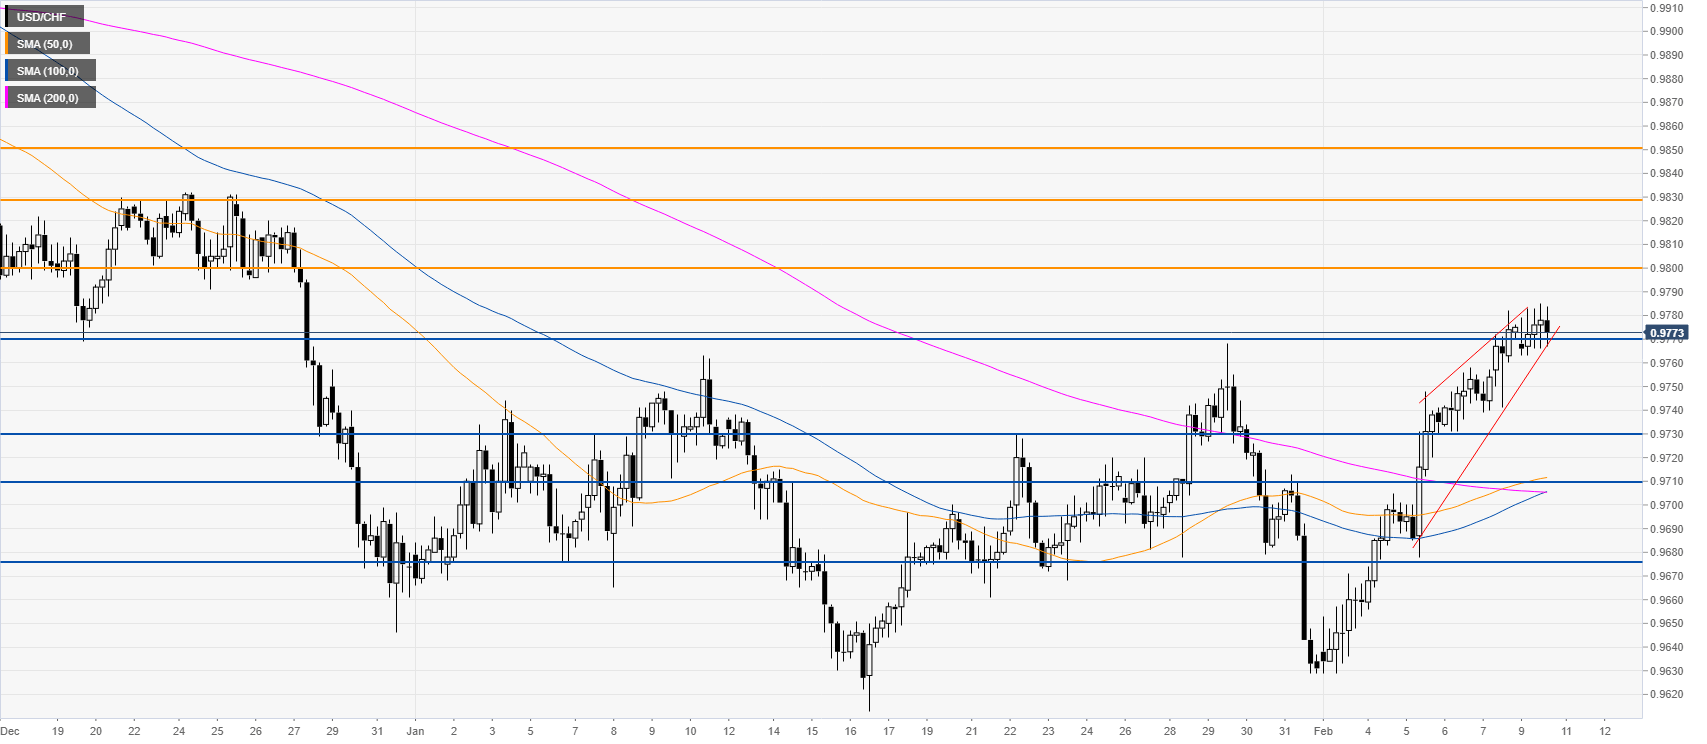
Resistance: 0.9800, 0.9830, 0.9850
Support: 0.9770, 0.9730, 0.9710
Additional key levels
