- USD/JPY recovery is likely exhausted below the 109.87 resistance.
- The level to beat for bears is the 109.64/53 price zone.
USD/JPY daily chart
USD/JPY is trading below the 110.00 figure while within Friday’s range. The spot is holding above the main daily simple moving averages (SMAs).

USD/JPY four-hour chart
The quote is losing steam below the 109.87 resistance while trading above the main SMAs. A break below the 109.64/53 support zone could drive USD/JPY towards the 109.20 level, according to the Technical Confluences Indicator. Resistances are seen near the 109.87 and 110.10 price levels.
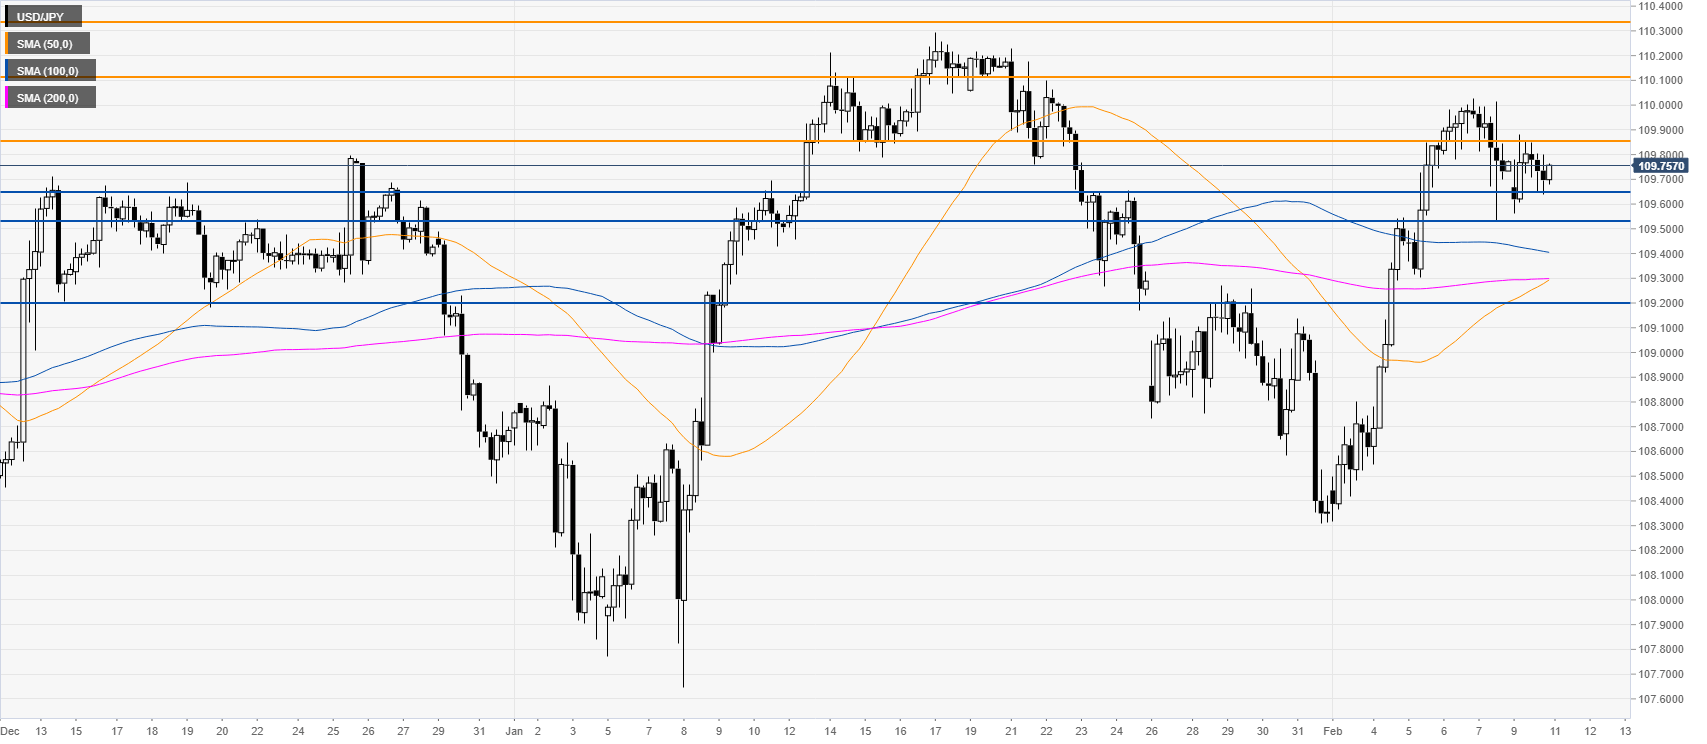
Resistance: 109.87, 110.10, 110.33
Support: 109.64, 109.53, 109.20
Additional key levels
