- GBP/JPY remains under pressure inside a bullish technical pattern.
- 200-bar SMA adds to the resistance, November 2019 low will follow the formation’s downside break.
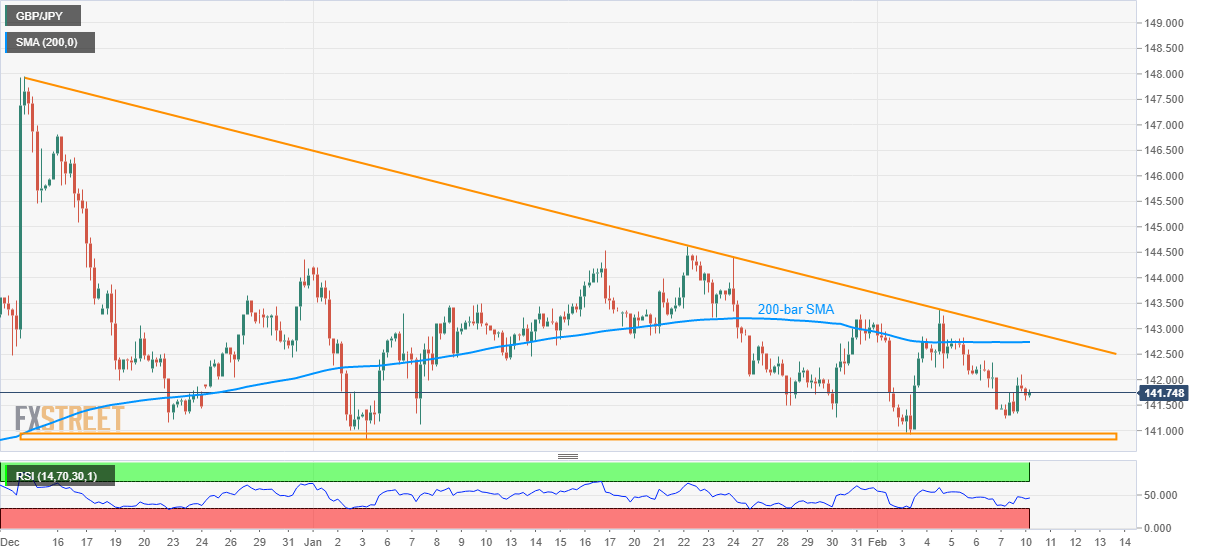
GBP/JPY stays a little weak while taking rounds to 141.75 during the early Asian session on Tuesday. The pair forms a descending triangle while observing its moves from December 13.
That said, the quote’s current weakness might find support around 140.83/97 area, if not then the bullish pattern gets negated.
In doing so, the quote opens the door for a fresh fall towards November 20196 bottom close to 139.32. However, 140.00 round-figure might offer an intermediate halt during the declines.
Alternatively, 200-bar SMA near 142.75 adds a filter to the pair’s run-up towards the pattern’s resistance, currently at 142.95.
Should there be a sustained rise beyond 143.00, the yearly top close to 144.60 will become the buyers’ favorite.
GBP/JPY four-hour chart
Trend: Sideways
