- USD/JPY recovery is showing sign of exhaustion below the 109.87 resistance.
- The level to beat for sellers is the 109.64/53 price zone.
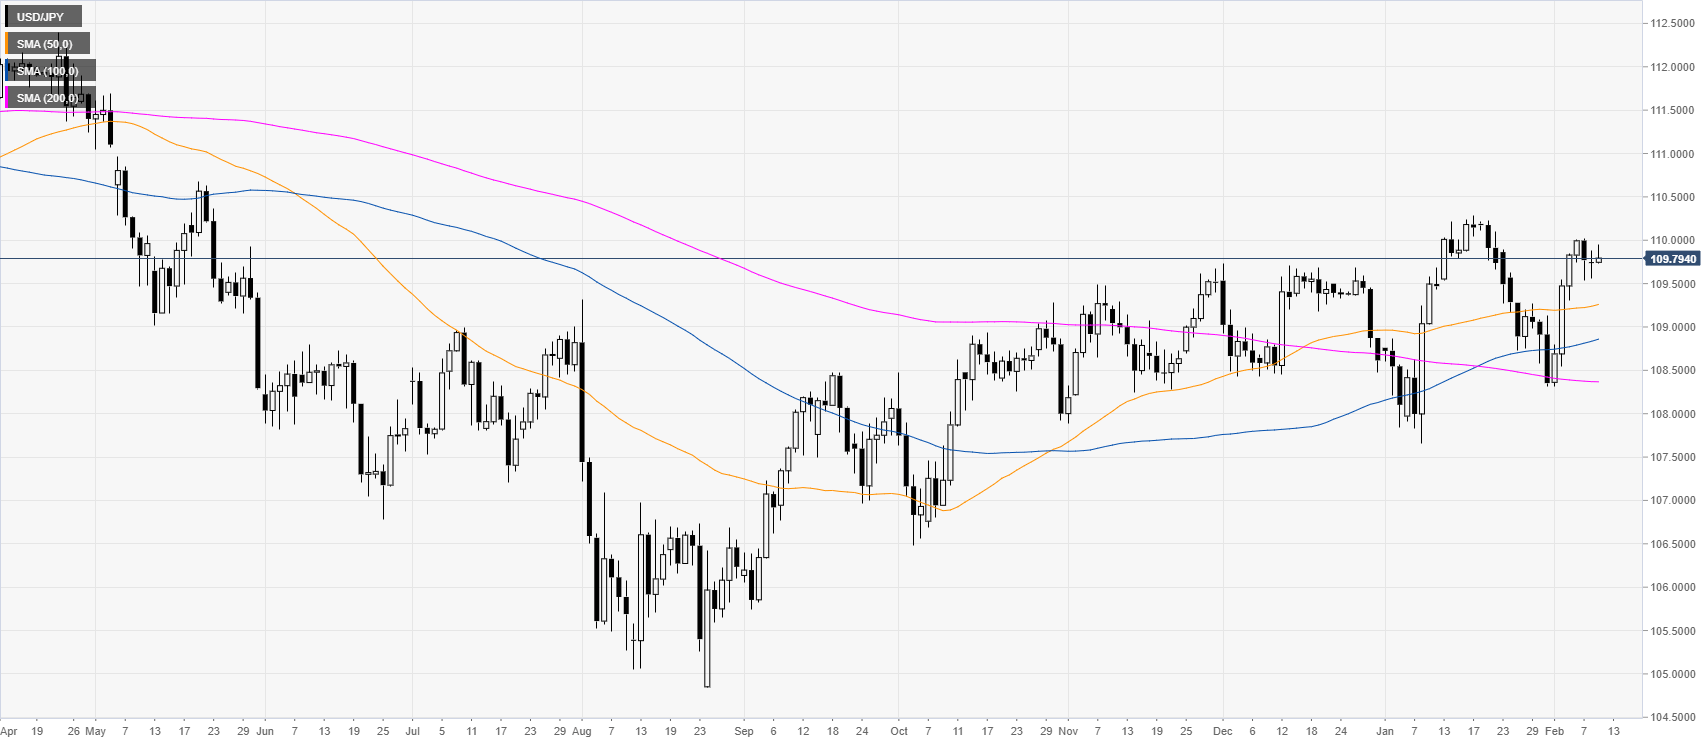
USD/JPY daily chart
USD/JPY is trading below the 110.00 figure while consolidating the recent gains for the third day in a row. USD/JPY is holding above the main daily simple moving averages (SMAs).
USD/JPY four-hour chart
The spot is losing bullish momentum below the 109.87 resistance while trading above the main SMAs. If the bears have a break below the 109.64/53 support zone, USD/JPY might pull back down towards the 109.20 level, according to the Technical Confluences Indicator. Resistances are seen near the 109.87 and 110.10 price levels.
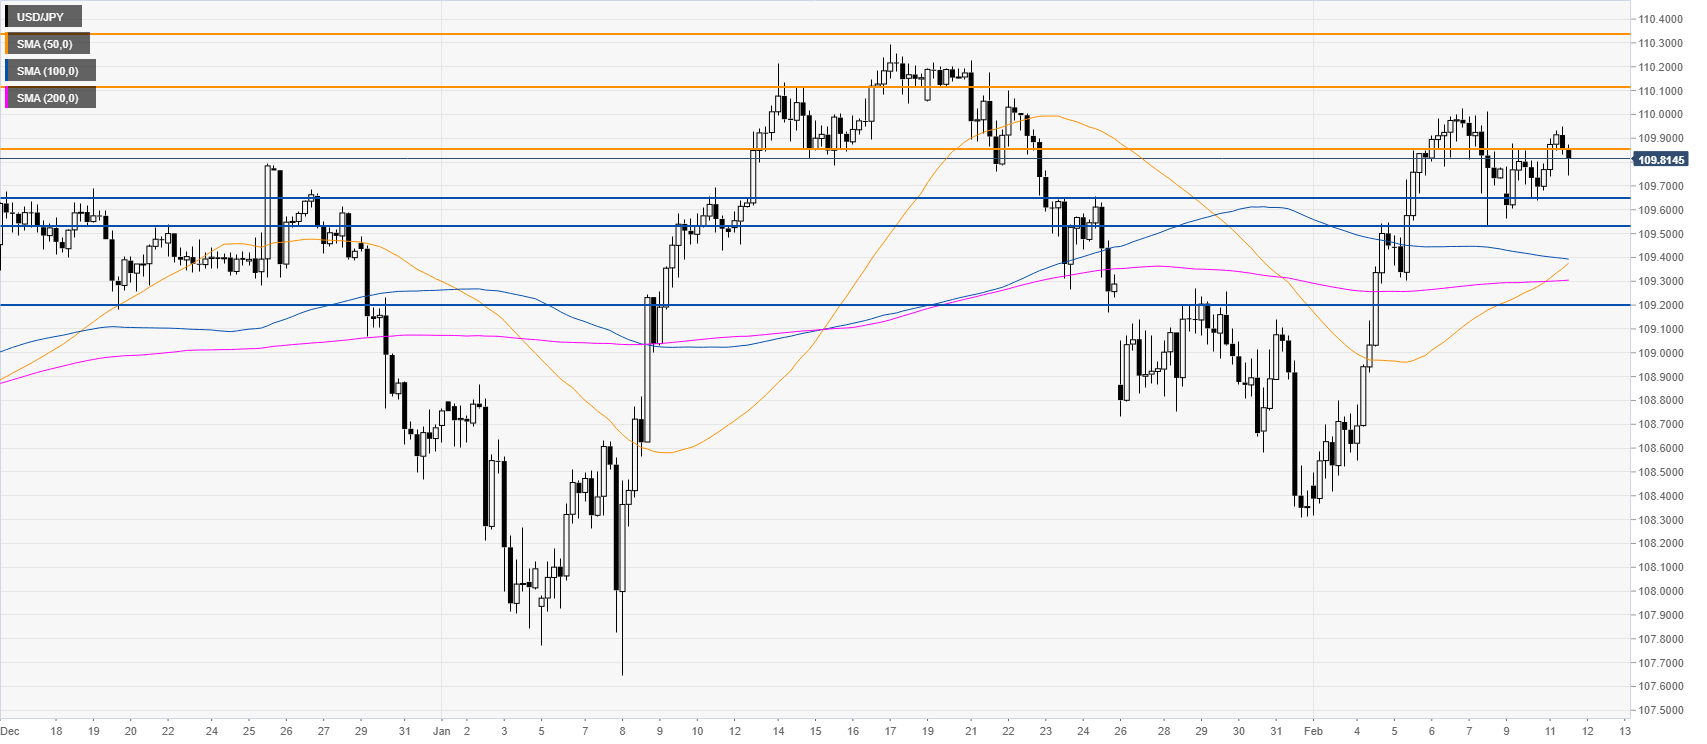
Resistance: 109.87, 110.10, 110.33
Support: 109.64, 109.53, 109.20
Additional key levels
