- USD/IDR’s Bollinger Bands are reporting neutral bias for first since early December.
- A break above the upper band is needed to confirm a bullish reversal.
USD/IDR’s daily chart Bollinger Bands – standard deviation of +2/-2 on price’s 20-day moving average – have turned flat for the first time since early December, signaling a neutral bias.
A close above the upper Bollinger Band at 13,757 would confirm a bullish breakout and open the doors for a test of the former support-turned-hurdle of 13,883 (July 19 low).
On the flip side, a breakdown below the lower Bollinger Band, currently at 13,596, would imply a continuation of the sell-off from highs above 14,300 observed in August 2019 and shift risk in favor of a slide to 13,500.
At press time, the pair is trading at 13,695.
Daily chart
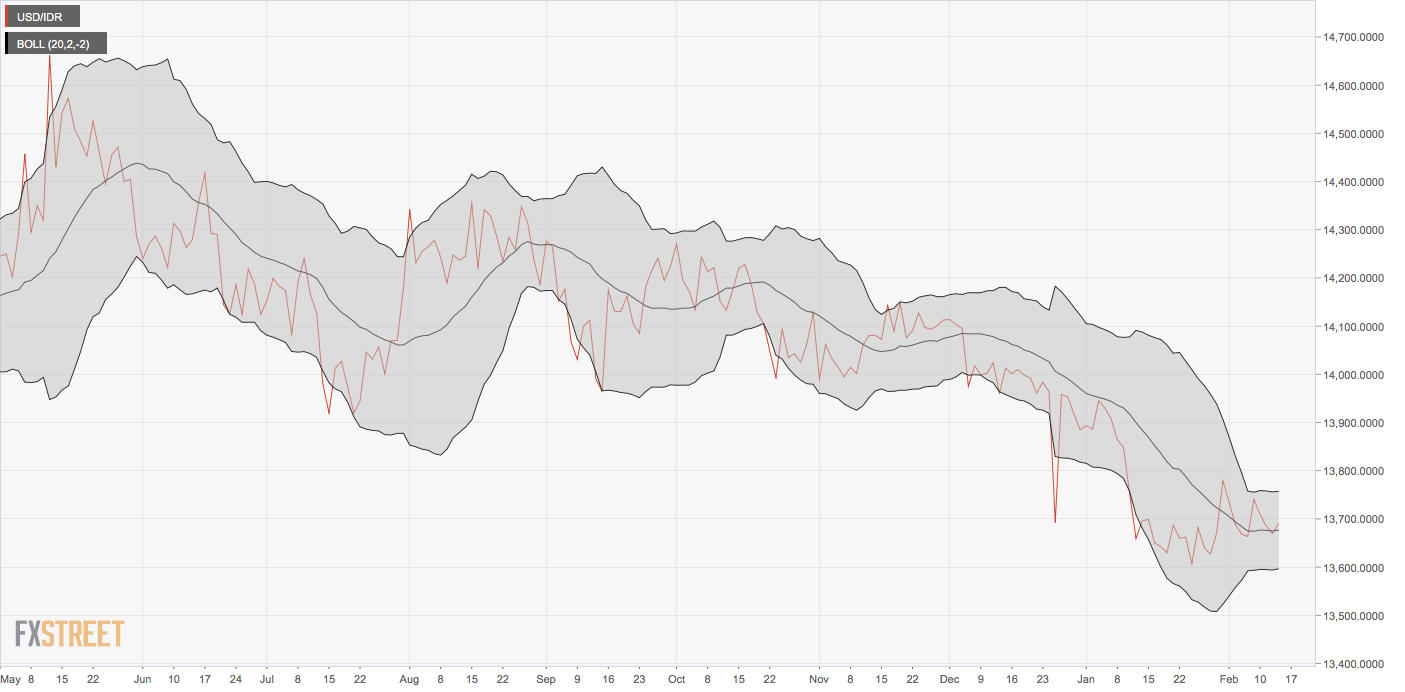
Trend: Neutral
Technical levels
