- USD/INR recovers from multi-week-long support line.
- A near-term resistance trend line guards the upside.
- Technical indicators suggest continuation of gradual advances from July 2019.
USD/INR trades 0.20% positive to 71.43 ahead of the European session on Thursday. In doing so, the quote carries its pullback from the ascending trend line stretched since July 2019.
However, a downward sloping trend line from early-January, at 71.52 now, guards the immediate upside.
Should prices manage to cross 71.52, for which MACD and RSI are both in favor, January 30 top near 71.86 and the yearly high around 72.57 will sooner or later return to the charts.
Meanwhile, a downside break of support line, currently at 71.05, could take aim at 70.60 ahead of challenging December 2019 low near 70.28.
In a case prices keep trading southwards past-70.28, 70.00 round-figure and June 2019 low near 69.00 can please the bears.
USD/INR weekly chart
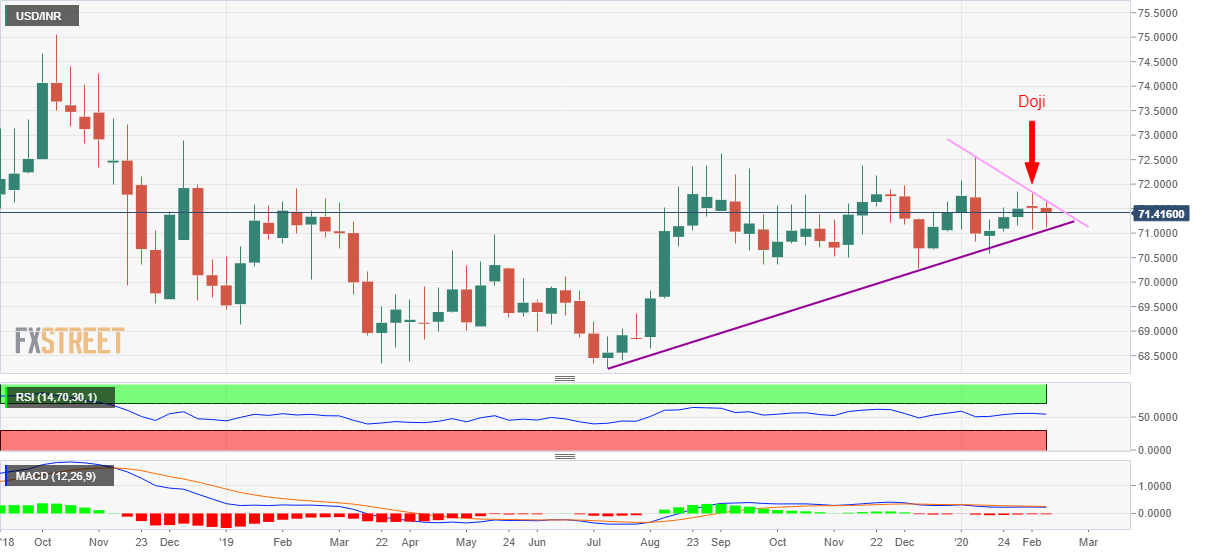
Trend: Bullish
FXStreet Indonesian Site – new domain!
Access it at www.fxstreet-id.com
