- GBP/JPY seesaws around three-week high.
- 50% of Fibonacci retracement limit the pair’s immediate upside.
- A downside break of 142.65/60 support confluence can aim for the monthly low.
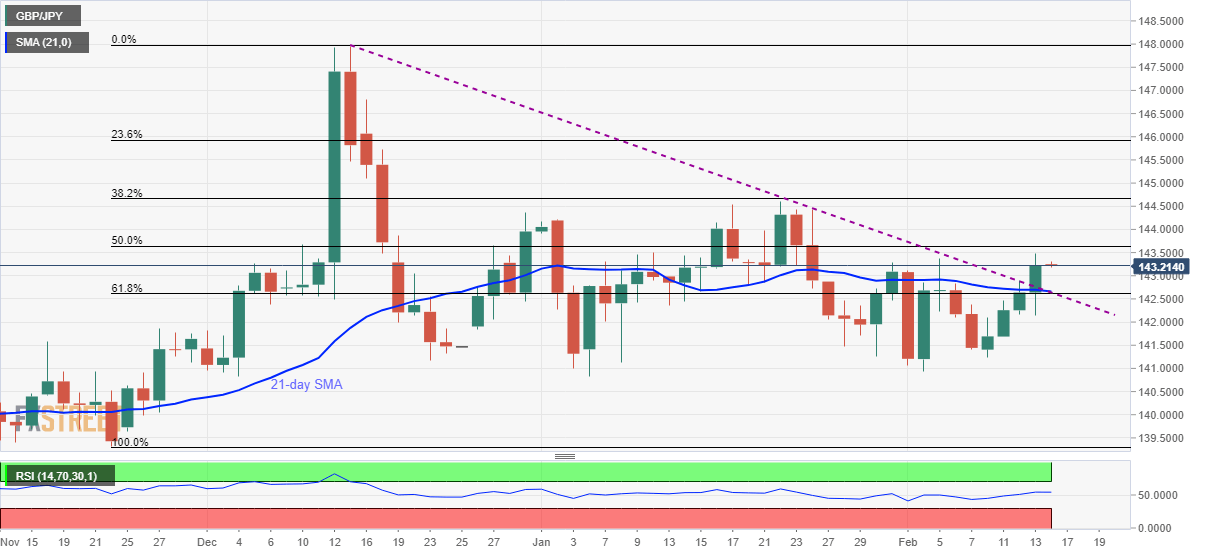
GBP/JPY steps back from three-week high to 143.20 amid Friday’s Asian session. In doing so, the quote fails to extend the break of 21-day SMA and a descending trend line stretched since December 13, 2019.
While buyers might be waiting for fresh fundamental impulse, 50% Fibonacci retracement of the pair’s November-December 2019 upside, at 143.65, will be on their radar.
Should there be a further run-up past-143.65, which is expected based on the pair’s latest breakout of the key upside hurdle and normal RSI conditions, January 22 high near 144.60 can return to the charts.
Alternatively, a downside break of 142.65/60 support confluence including 21-day SMA, 61.8% Fibonacci retracement and the resistance-turned-support line could drag the pair to the weekly low near 141.25.
Even so, the monthly bottom close to 140.90 and January month low surrounding 140.80, also marked in December 2019, should be questioning the bears past-141.25.
GBP/JPY daily chart
Trend: Bullish
