- USD/CAD remains on the back foot, follows a one-week-old falling trend line.
- 200-bar SMA, 50% Fibonacci retracement can please sellers below the fresh monthly bottom.
- 1.3330 offers the key upside resistance.
USD/CAD declines to 1.3238, down 0.10%, by the press time of the pre-European session on Monday.
Other than the pair’s sustained follow-up of the one-week-old descending trend line, its break of 100-bar SMA also favors the sellers. However, bears are waiting for entry below the monthly low surrounding 1.3230.
In doing so, 38.2% Fibonacci retracement level of the pair’s rise from December 31, 2019, to February 10, 2020, around 1.3185, will be on their radars.
Alternatively, an upside clearance of the short-term falling trend line, at 1.3250 now, can trigger the pair’s fresh run-up towards 1.3280 and 1.3300.
However, the bears can’t lose their hopes unless the quote rallies beyond the monthly top surrounding 1.3330.
USD/CAD four-hour chart
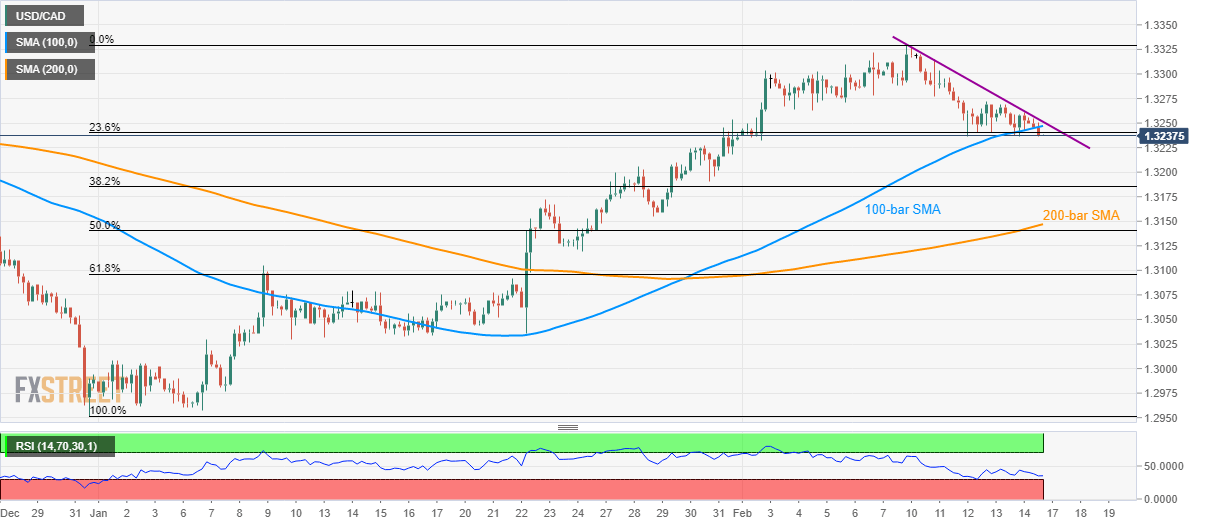
Trend: Pullback expected
