- USD/CNH snaps three-day winning streak.
- 61.8% of Fibonacci retracement can lure sellers below the triangle’s support.
- 100-day SMA offers an intermediate halt to the monthly top.
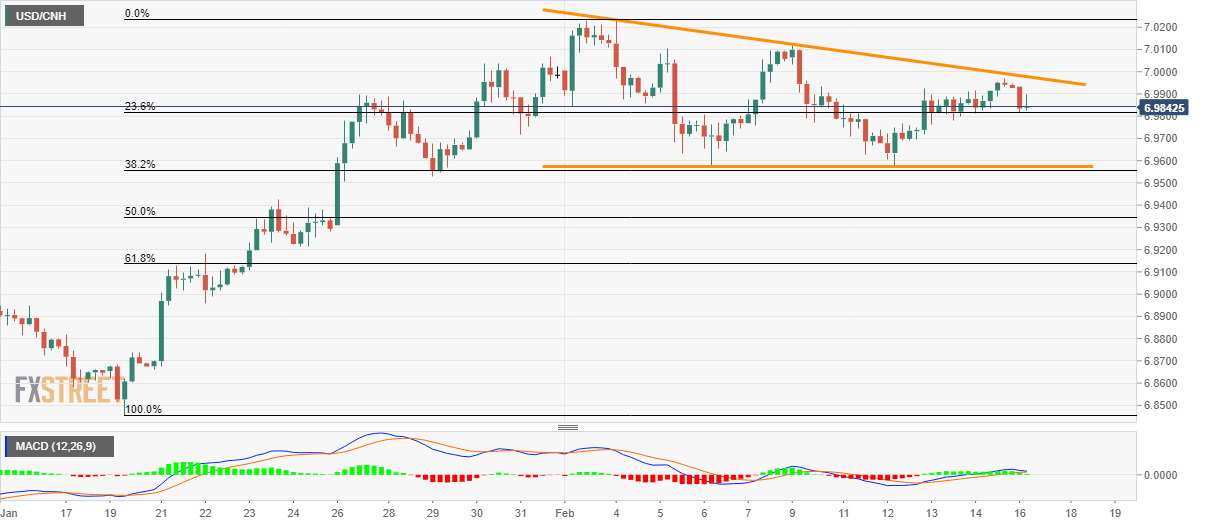
USD/CNH declines to 6.9840 during early Monday. In doing so, the pair respects a two-week-old descending triangle formation.
As a result, sellers can now take aim at the pattern’s support and 38.2% Fibonacci retracement of January 20 to February 04 upside, around 6.9575/55 area.
However, a sustained downside below the same, which is less likely, might not refrain from challenging the 61.8% Fibonacci retracement level of 6.9130.
Alternatively, the pair’s upside break of triangle’s resistance, at 6.9980 now, requires a validation from a 100-day SMA level on the daily chart, currently around 7.0120, to challenge the monthly top near 7.0235.
If at all buyers dominate past-7.0235, December month high near 7.0870 will become their next target.
USD/CNH four-hour chart
Trend: Bearish
