- AUD/NZD drops below the short-term key support after RBA minutes reiterate its bearish bias.
- 50% Fibonacci retracement, 200-bar SMA confluence is on the bears’ radar.
- An upside beyond the weekly high can trigger the fresh recovery.
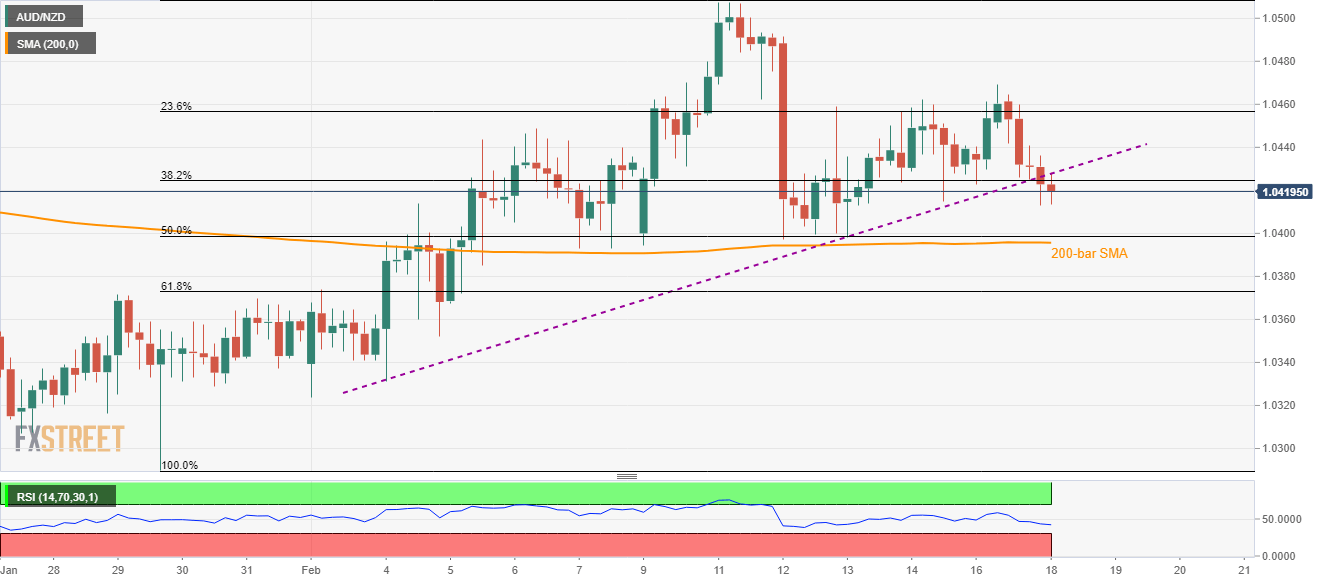
AUD/NZD declines to 1.04155 following the RBA minutes’ release during early Tuesday. In doing so, the quote drops below an ascending trend line stretched from February 04.
Read: RBA Minutes: Board prepared to ease policy if needed – Retuers
As a result, sellers are now targeting the confluence of 50% Fibonacci retracement of the pair’s run-up between January 29 and February 11 as well as 200-bar SMA, around 1.0400/395.
During the quote’s further weakness below 1.0395, 61.8% Fibonacci retracement near 1.0370 and 1.0325 can stop the bears from aiming 1.03000 mark.
Alternatively, an upside break of the support-turned-resistance, at 1.0430 now, can challenge the weekly high surrounding 1.0465.
If AUD/NZD prices manage to stay strong beyond 1.0465, the monthly top surrounding 1.0510 could return to the charts.
AUD/NZD four-hour chart
Trend: Bearish
