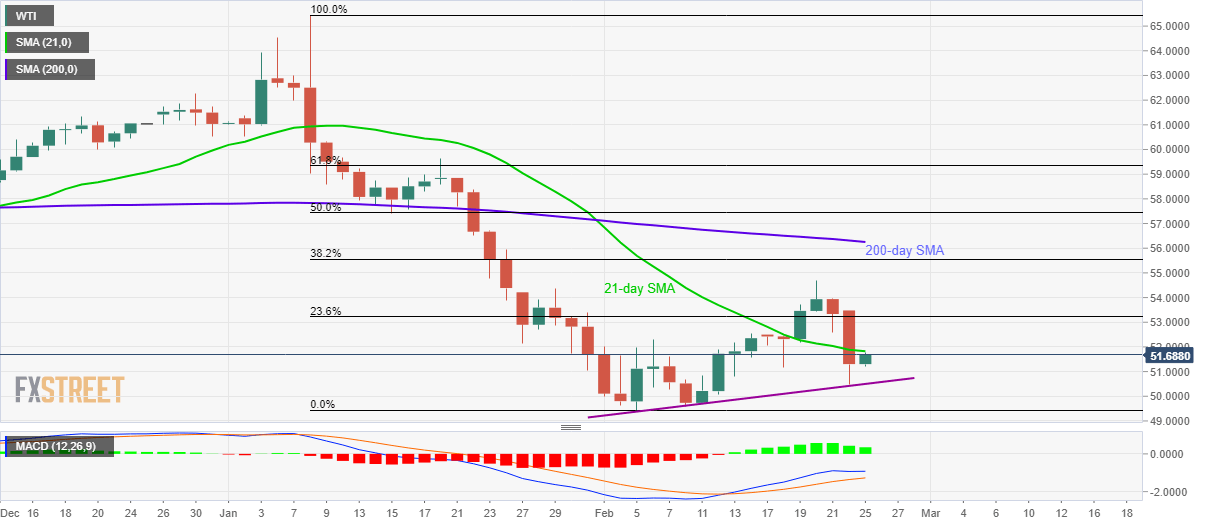
- WTI bounces off the two-week low.
- The monthly rising support line restricts immediate declines.
- 23.6% Fibonacci retracement adds to the resistance.
WTI recovers 0.70% to $51.67 during the Asian session on Tuesday. That said, black gold recently bounced off the monthly support line and is currently probing 21-day SMA.
Given the bullish MACD and a pullback from the short-term support line, the energy benchmark is likely to cross 21-day SMA level of $51.83 and aim 23.6% Fibonacci retracement of its declines between January 08 and February 06, at $53.23.
It should, however, be noted that the monthly high surrounding $54.70 and 200-day SMA level around $56.25 will be the key during the oil price run-up beyond $53.23.
Meanwhile, a downside break below the immediate support line, at $50.50 now, can take rest around $50.00 before challenging the month’s low close to $49.40.
WTI daily chart
Trend: Pullback expected
