- AUD/USD struggles to extend the latest recovery.
- 100-HMA, triangle’s resistance question the buyers amid bullish MACD.
- Sellers look for entry below 23.6% Fibonacci retracement, triangle support.
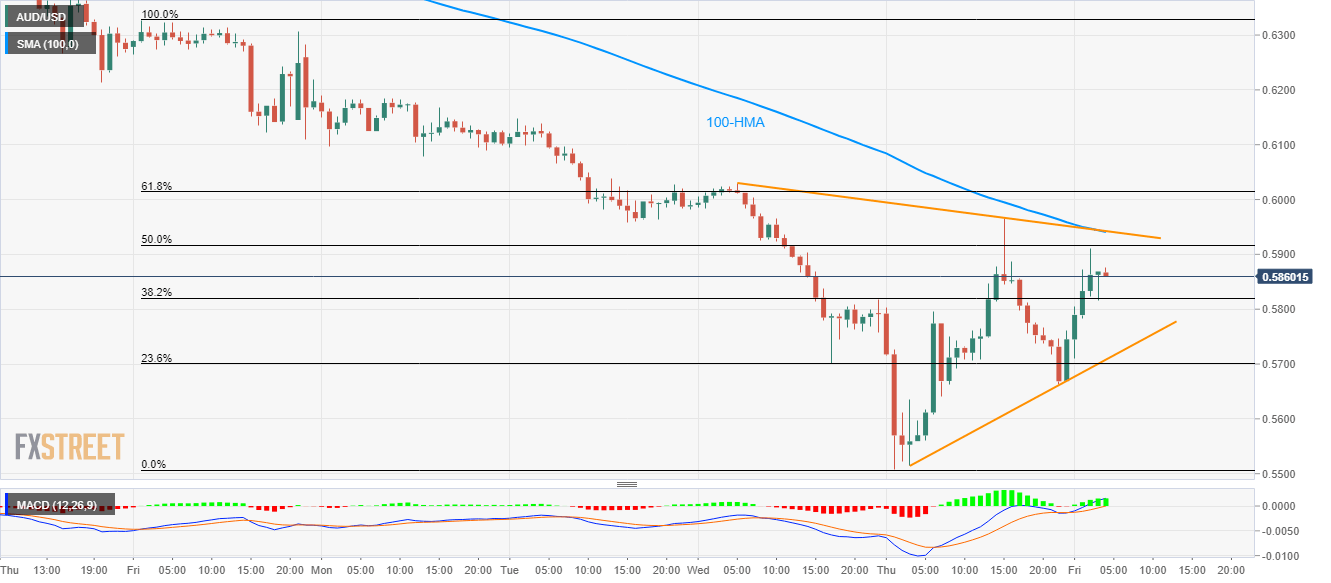
Despite bouncing off -1.0% to +2.15% at present, AUD/USD fades the strength above 0.5900 while taking rounds to 0.5870 during the early Friday.
In doing so, the Aussie pair stays inside a short-term symmetrical triangle below the 100-Hour Moving Average (HMA).
Even so, the bullish MACD propels the quote once again to test the waters above 0.5900 while targeting to confront the formation resistance and the 100-HMA confluence around 0.5940.
In a case where the bulls manage to cross 0.5940, 0.6000 and 61.8% Fibonacci retracement of its declines between March 13 and 19, at 0.6015, could return to the charts.
Meanwhile, the pair’s declines below the formation support and 23.6% Fibonacci retracement, around 0.5700 will be important to watch as it can recall the recently fleshed 11-year low close to 0.5510.
AUD/USD hourly chart
Trend: Further recovery expected
