- NZD/USD remains on the back foot.
- 61.8% Fibonacci retracement, 200-HMA add to resistances.
- The monthly bottom holds the key to further downside.
NZD/USD declines 1.1% to 0.5650 by the press time of Japan open on Monday. The Kiwi pair might have taken clues from the recent surge in cases from New Zealand.
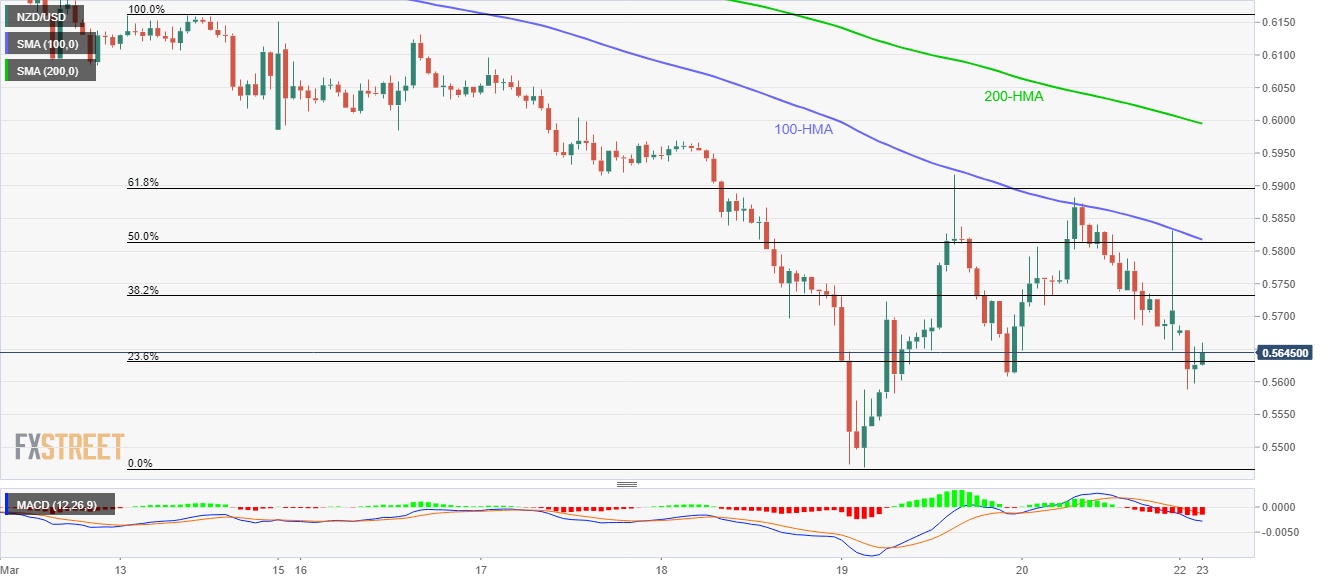
The pair currently declines towards the monthly low surrounding 0.5470 while 0.5600 can offer an intermediate halt.
During the pair’s further downside past-0.5470, 0.5400 and April 2003 low near 0.5330 will flash on the bears’ radars.
On the contrary, 100-HMA and 50% Fibonacci retracement of March 13-19 declines, around 0.5815/20 seems to limit the pair’s near-term upside.
In a case where the buyers manage to cross 0.5820, 61.8% Fibonacci retracement level of 0.5900 and 200-HMA near 0.6000 will return to the charts.
NZD/USD hourly chart
Trend: Bearish
