- NZD/USD remains positive above short-term key resistances (now supports).
- 200-HMA on the bulls’ radars, multiple support to question the bears’ re-entry.
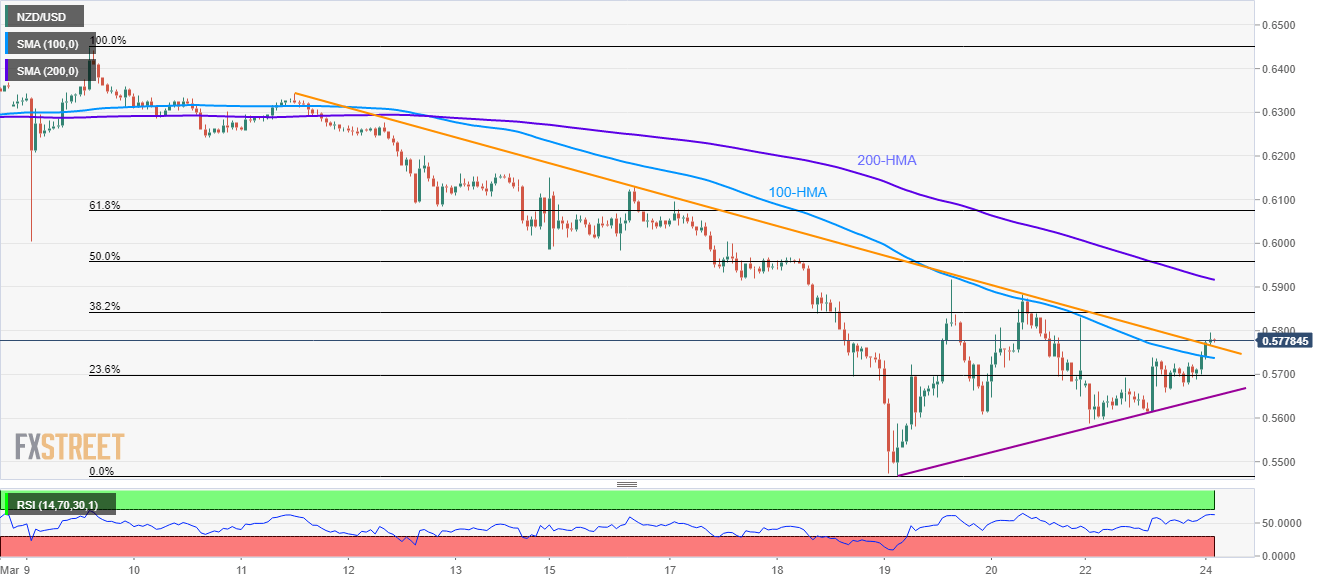
Having breached 100-HMA and two-week-old falling trend line, NZD/USD takes the bids to 0.5780, up 1.10%, during the initial trading hours on Tuesday.
The kiwi pair currently extends the recovery moves towards a 200-HMA level of 0.5916. However, 38.2% Fibonacci retracement of its declines between March 09 and 19, around 0.5840 could offer the immediate resistance.
During the quote’s further upside past-0.5916, 0.6000 and 61.8% Fibonacci retracement near 0.6075 could lure the bulls.
Alternatively, the resistance-turned-support trend line and 100-HMA, respectively near 0.5765 and 0.5735, can act as the nearby rests should the buyers fail to dominate.
Also limiting the pair’s near-term declines will be a 23.6% Fibonacci retracement level of 0.5700 and a three-day-old support line around 0.5650.
NZD/USD hourly chart
Trend: Further recovery expected
