- XAU/USD is correcting down after the massive bull-run seen last week.
- XAU/USD is set to remain under pressure below the 1600 mark.
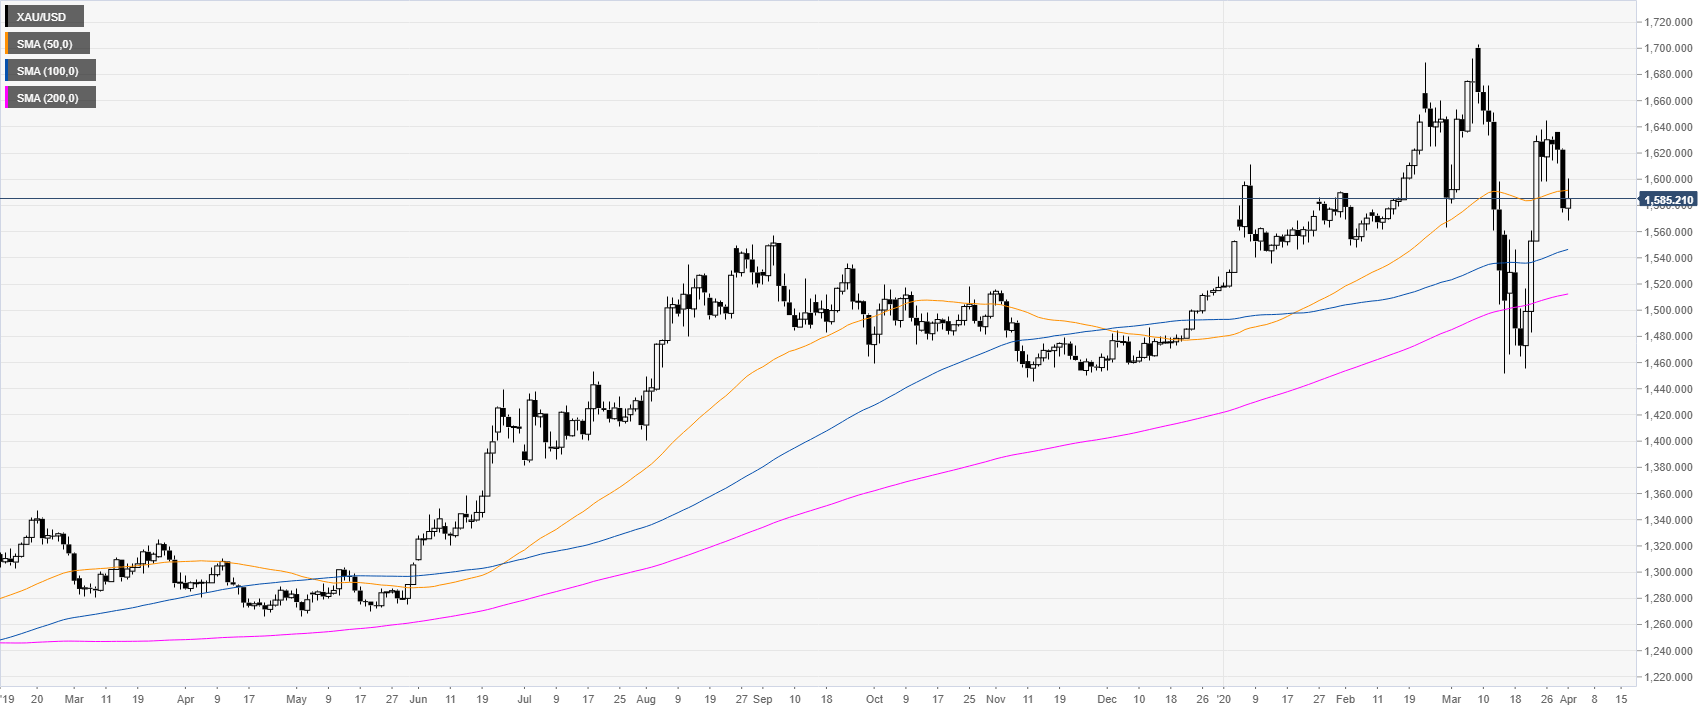
XAU/USD daily chart
Gold is consolidating the bullish spike originating from the 2020 lows while trading now below the 50 DMA (daily simple moving average).
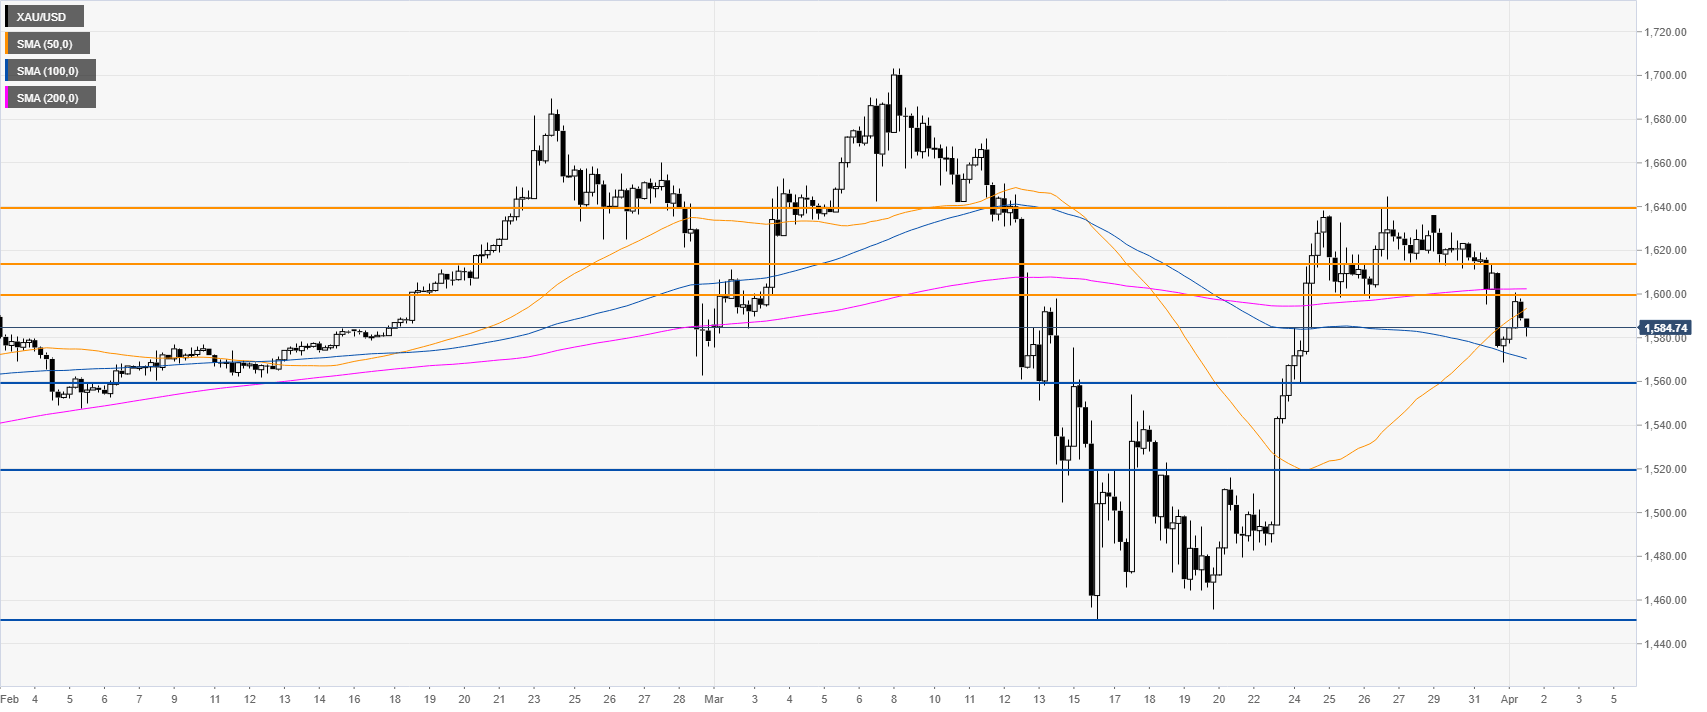
XAU/USD four-hour chart
XAU/USD is trading below the 1600 level and the 50/200 SMAs suggesting a negative bias in the medium term as sellers want a break below the 1560 support level en route towards 1520 and potentially to 1450 if the bears gather enough steam. Resistance can be expected near 1600, 1615 and 1640 levels.
Additional key levels
