- US dollar index (DXY) is consolidating in the 99.00/100.00 zone.
- The level to beat for bulls is the 100.00 handle.
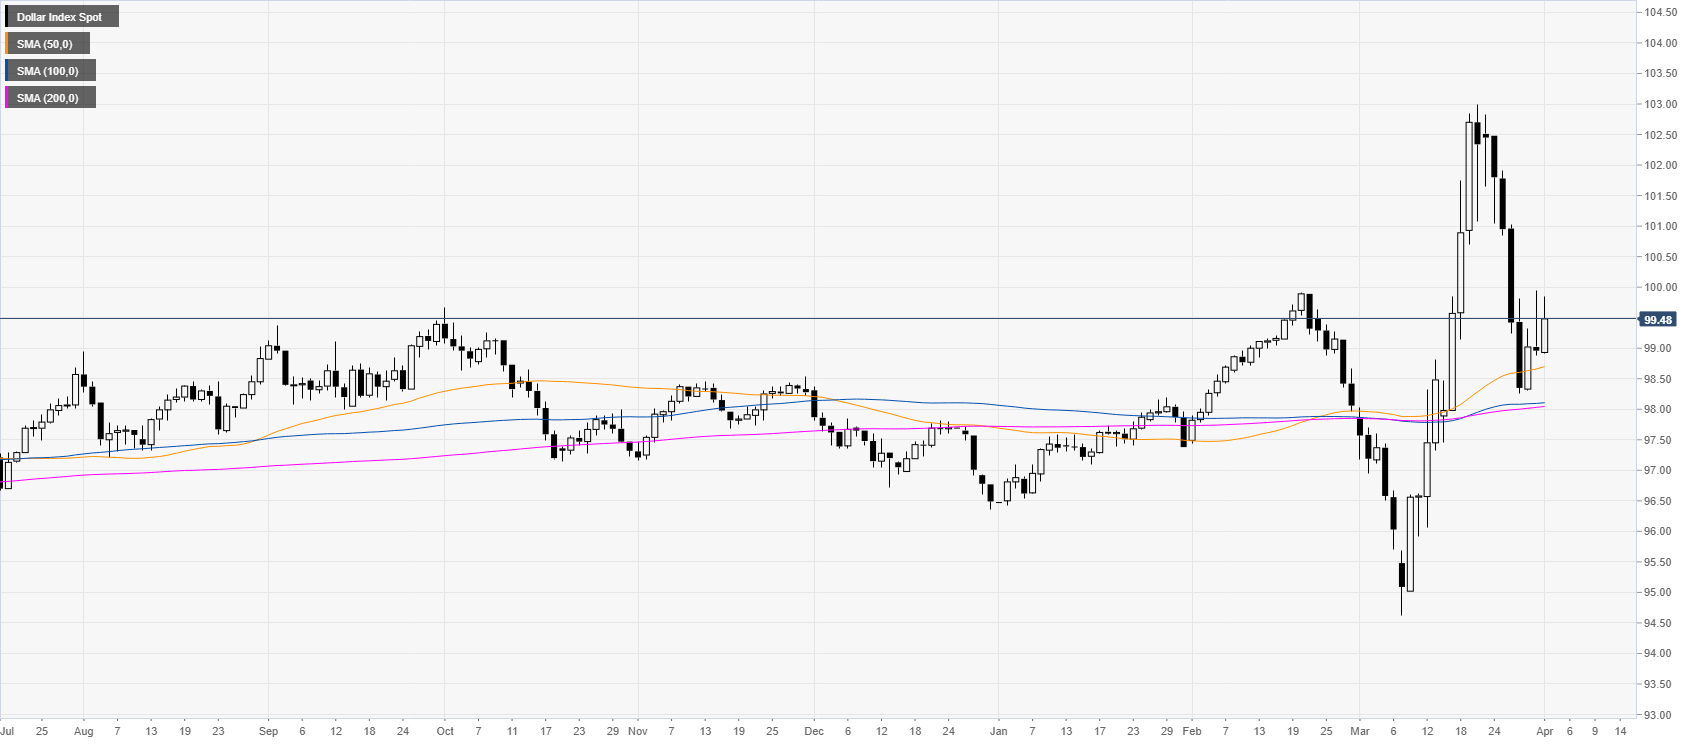
DXY daily chart chart
Last week, DXY experienced its largest weekly decline since April 1986 as the greenback challenged the 50-day simple moving average on the daily chart.
DXY four-hour chart
DXY is trying to find some footing above the 98.25 level and the main SMAs as a close above the 100.00 psychological level remains for now illusive. However, a move beyond the above-mentioned level can open the doors to the 100.50 and 101.50 resistances on the way up. On the flip side, bears would need to have a daily close below the 98.00 figure to extend the bearish leg from last week.
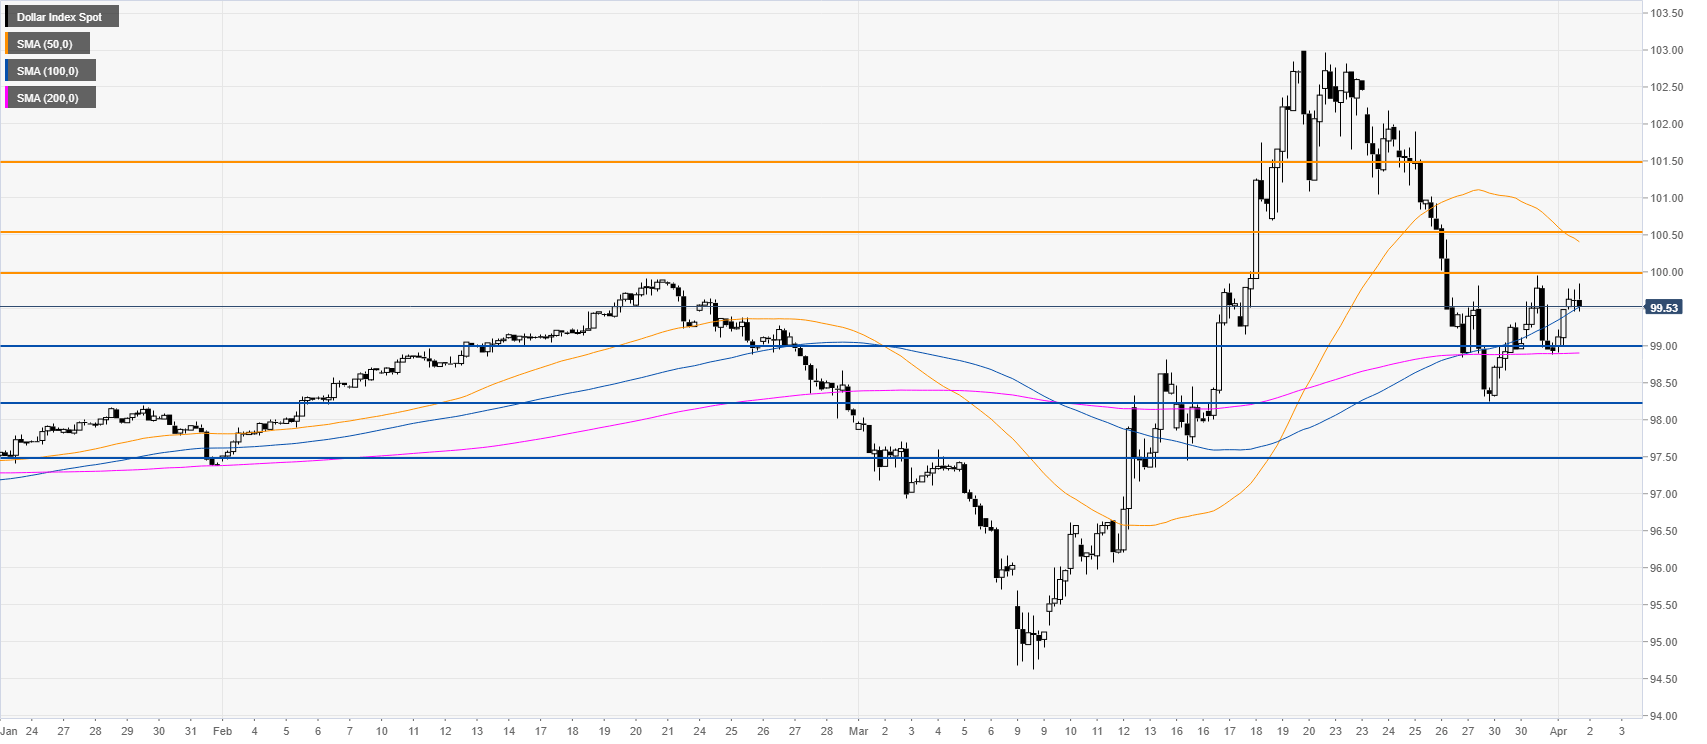
Additional key levels
