- USD/JPY is easing from March’s tops while breaking below the main SMAs on the four-hour chart.
- The level to beat for bears is the 107.00 figure.
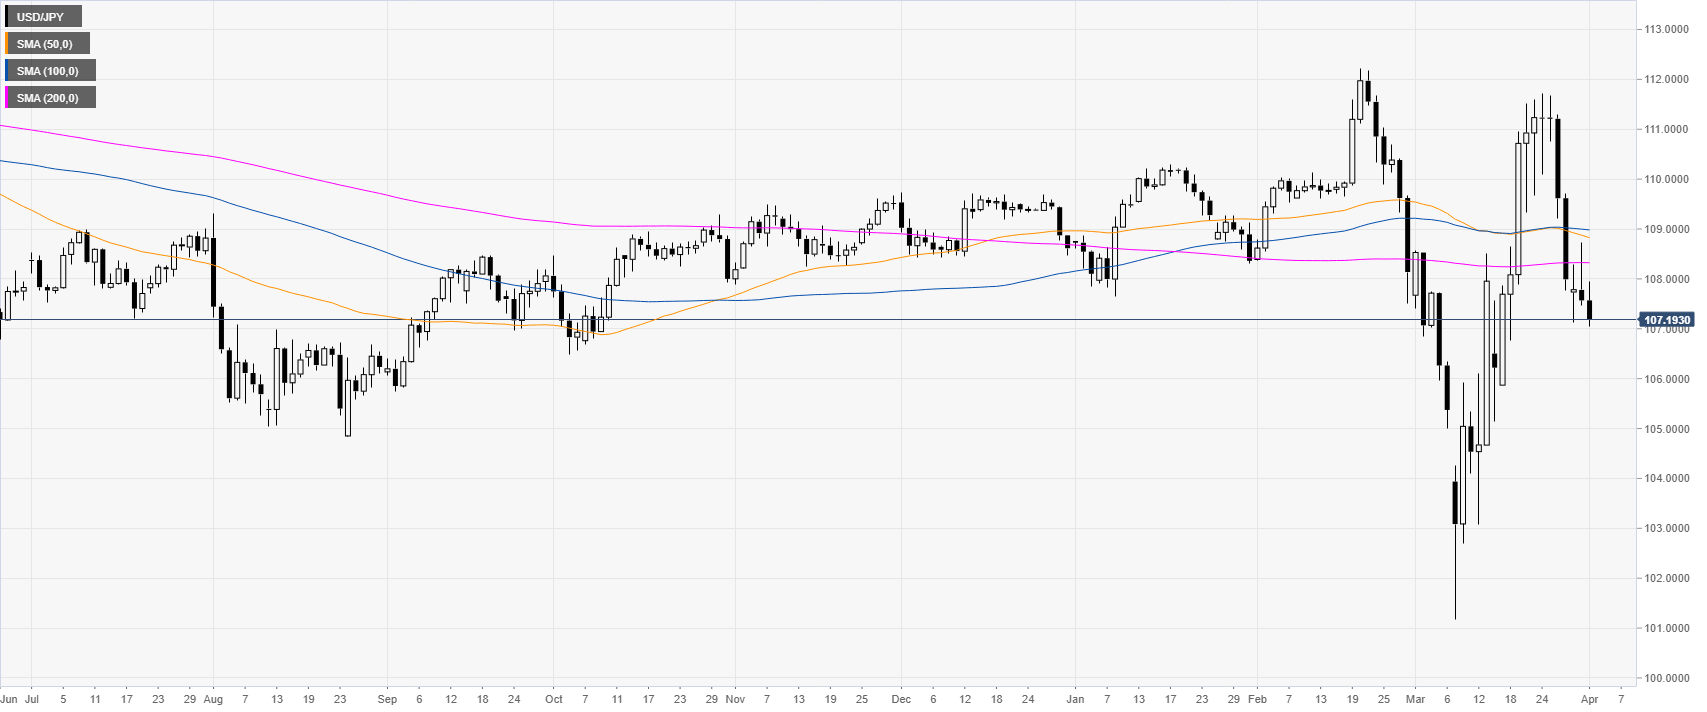
USD/JPY daily chart
USD/JPY is pulling back down from the March’s tops as the spot broke below the 200 SMA on the daily chart.
USD/JPY four-hour chart
USD/JPY is trading below the main SMAS suggesting a bearish momentum in the medium term. A break below the 107.00 figure can lead to further declines towards the 105.00 and 103.00 levels. Resistance can be seen near the 108.80, 110.00 and 111.00 price levels.
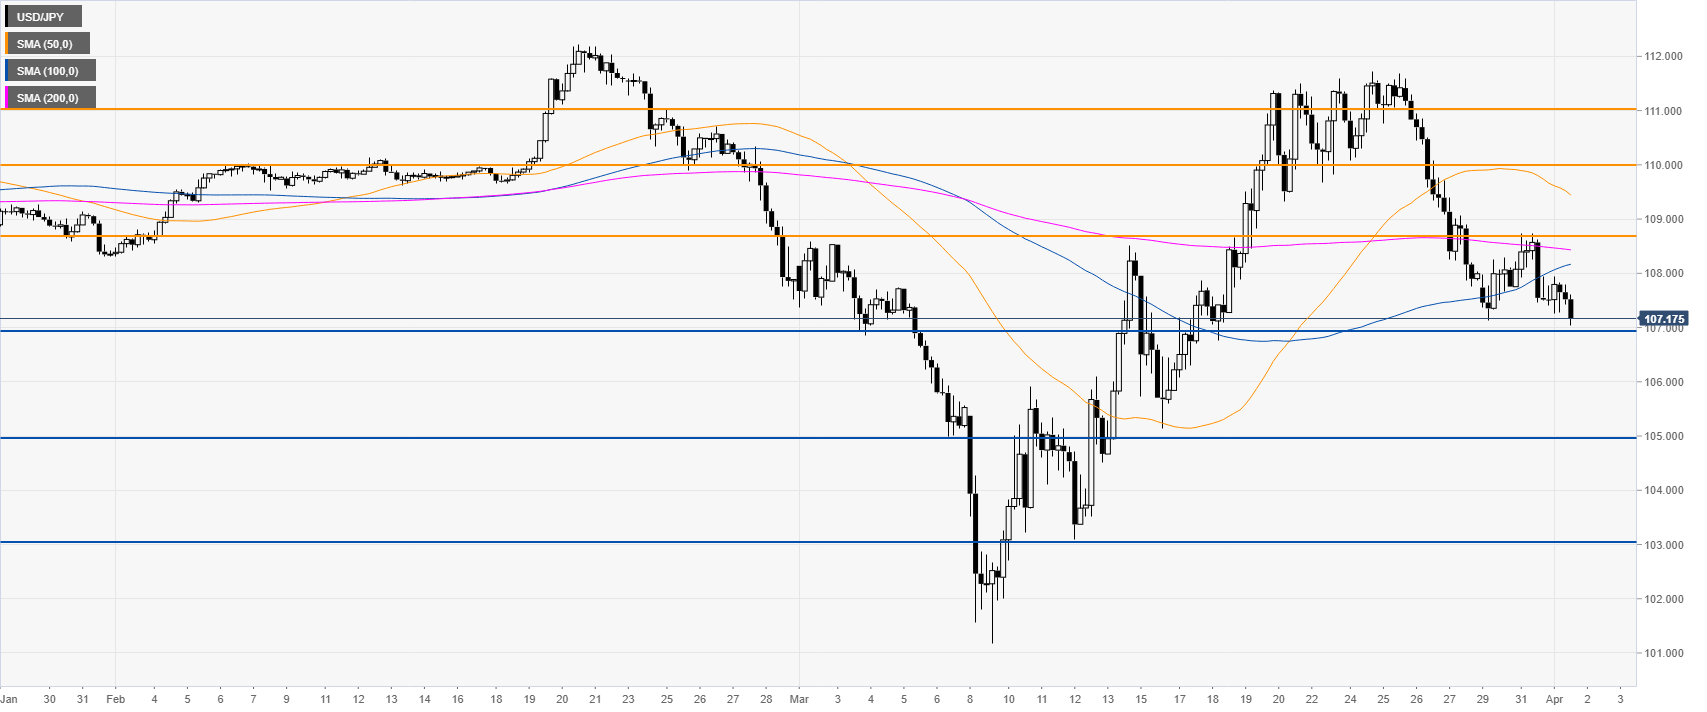
Resistance: 108.80, 110.00, 111.00
Support: 107.00, 105.00 103.00
Additional key levels
