- AUD/USD remains mildly bid while probing 50% Fibonacci retracement.
- 21-day SMA, 61.8% Fibonacci retracement could challenge the buyers.
- Sellers may target a level below 0.6000 psychological magnet.
AUD/USD extends the early-day recovery moves to 0.6092, up 0.35%, while heading into the European session on Thursday.
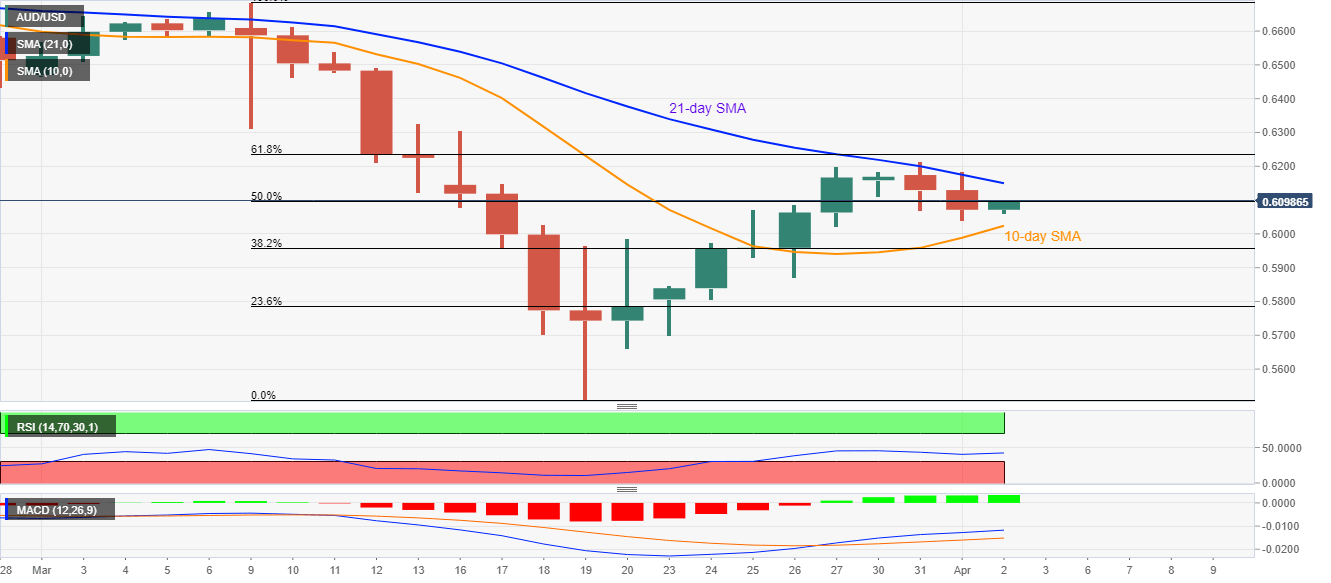
In doing so, the pair confronts the 50% Fibonacci retracement of March month declines and defies the previous two-day declines. However, the pair remains below 21-day SMA and 61.8% Fibonacci retracement level, which in turn question the buyers.
Not only a 21-day SMA level of 0.6150 and 0.6235, comprising 61.8% of Fibonacci retracement, but March 13 top near 0.6330 could also challenge the pair bulls.
On the contrary, a daily closing below 10-day SMA level of 0.6020 can recall 0.6000 mark on the chart whereas 38.2% Fibonacci retracement around 0.5955 may please the sellers afterward.
AUD/USD daily chart
Trend: Sideways
