EUR/USD has been on the back foot as a turbulent quarter is drawing to an end. How is the world’s most popular currency pair positioned on the charts?
The Technical Confluences Indicator is showing that euro/dollar is battling 1.0938, which is the convergence of the Fibonacci 23.6% one-day, the Simple Moving Average 50-4h, the SMA 5-15m, and the SMA 10-15.
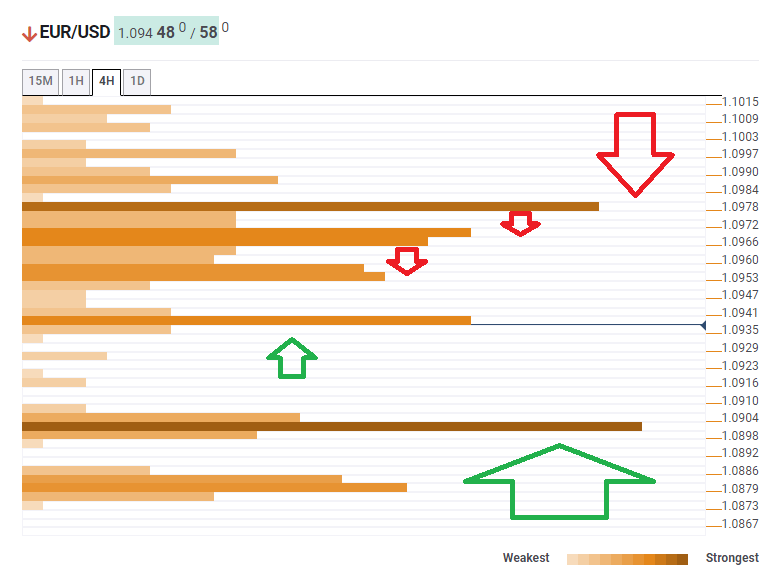
Support awaits at 1.0901, which is the meeting point of the Bollinger Band 4h-Lower and the SMA 10-one-day.
Resistance awaits at 1.0953, which is the confluence of the SMA 100-15m, the Fibonacci 38.2% one-week, and the Fibonacci 38.2% one-day.
It is followed by 1.0966, which is where the BB 1h-Upper and the Fibonacci 38.2% one-month converge.
Finally, 1.0978 is a robust resistance, where the SMA 200-15m, the SMA 100-4h, and the SMA 50-1h meet up.
Here is how it looks on the tool:
Confluence Detector
The Confluence Detector finds exciting opportunities using Technical Confluences. The TC is a tool to locate and point out those price levels where there is a congestion of indicators, moving averages, Fibonacci levels, Pivot Points, etc. Knowing where these congestion points are located is very useful for the trader, and can be used as a basis for different strategies.
This tool assigns a certain amount of “weight” to each indicator, and this “weight” can influence adjacents price levels. These weightings mean that one price level without any indicator or moving average but under the influence of two “strongly weighted” levels accumulate more resistance than their neighbors. In these cases, the tool signals resistance in apparently empty areas.
Learn more about Technical Confluence
