- GBP/USD registers modest gains inside a short-term ascending triangle.
- 100-HMA adds strength to the triangle’s support.
- 1.2485/90 acts as an additional upside barrier.
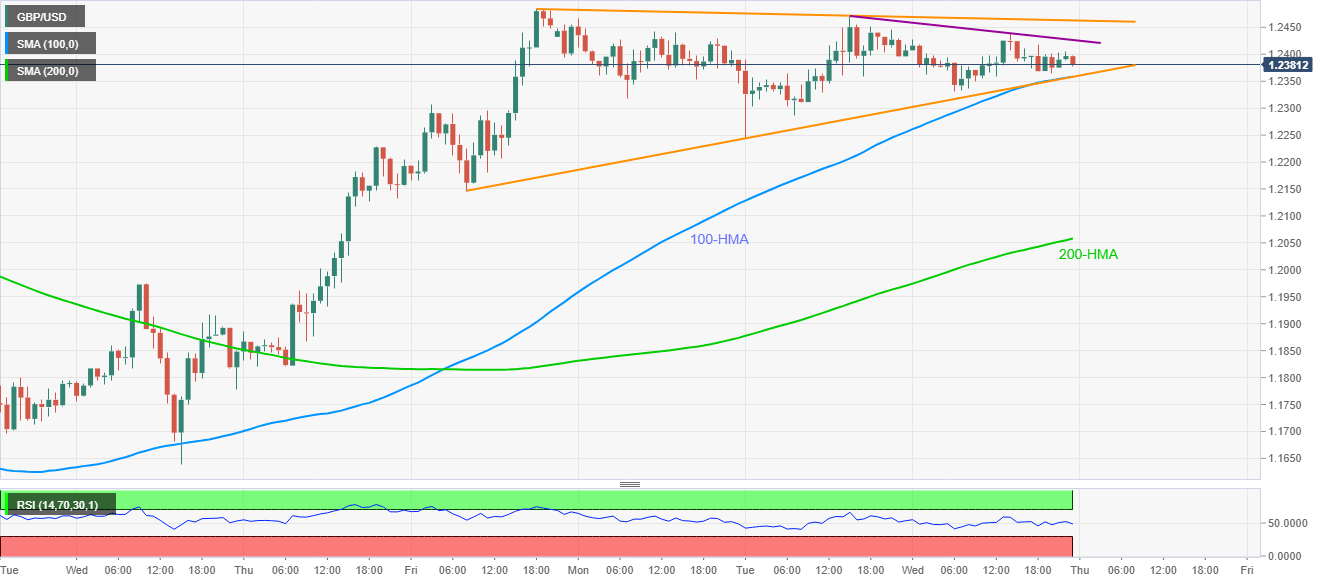
Despite recently declining from 1.2400 to 1.2380, GBP/USD remains inside a short-term ascending triangle formation amid the Asian session on Thursday. The repeated failures to cross 1.2485/90 resistance area, including March 12 low and March 27 high, portrays the Cable pair’s weakness. Even so, the triangle support and 100-HMA restrict the pair’s immediate declines.
Should there be a clear break below 1.2355 key support confluence, March 27 low near 1.2145, followed by 1.2125, will quickly appear on the bears’ radar.
During the pair’s additional weakness past-1.2125, 200-HMA near 1.2055 and 1.2000 will be the key to watch.
Alternatively, 1.2425 can act as the immediate resistance line to question the buyers in a case of the quote’s pullback, a break of which will extend recovery moves towards the triangle’s upper line, currently close to 1.2465.
If at all the bulls manage to cross 1.2465, they can again confront 1.2485/90 area that holds the gate for the pair’s rise towards 200-day SMA, at 1.2665 now, on the daily chart.
GBP/USD hourly chart
Trend: Pullback expected
