- GBP/USD remains capped between 21-day SMA and 1.2485/95 region.
- 61.8% Fibonacci retracement adds to the resistance.
- Sellers look for entry below 21-day SMA.
GBP/USD remains modestly changed while taking rounds to 1.2395 amid the Asian session on Friday. In doing so, the pair continues to stay below a short-term horizontal resistance and 21-day SMA support.
With RSI conditions also portraying the range-bound momentum, traders are less likely to be interested in the pair unless breaking 1.2495-1.2265 range.
It should also be noted that 1.2500 round-figure and 61.8% Fibonacci retracement of March month declines, at 1.2515, add to the upside barriers.
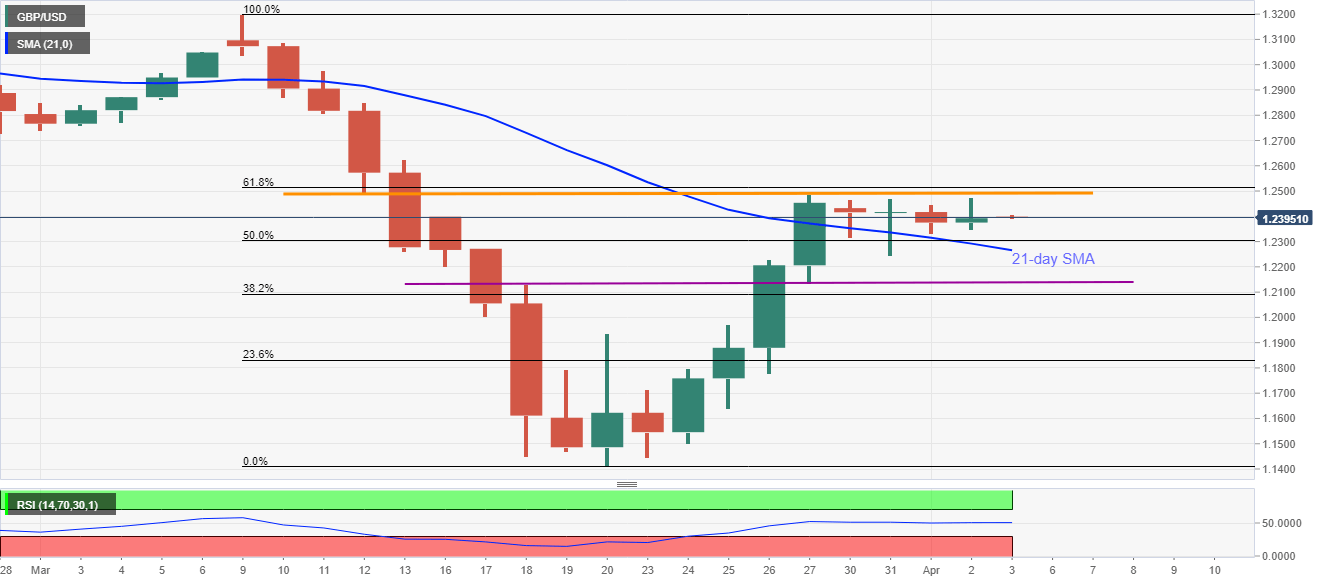
On the contrary, pair’s declines below 21-day SMA level of 1.2265 could take rest around 1.2135/30 ahead of testing 38.2% Fibonacci retracement level of 1.2090.
GBP/USD daily chart
Trend: Sideways
