- US dollar index (DXY) is starting the week mixed while holding onto last week’s gains.
- The level to beat for bulls is the 101.00 resistance.
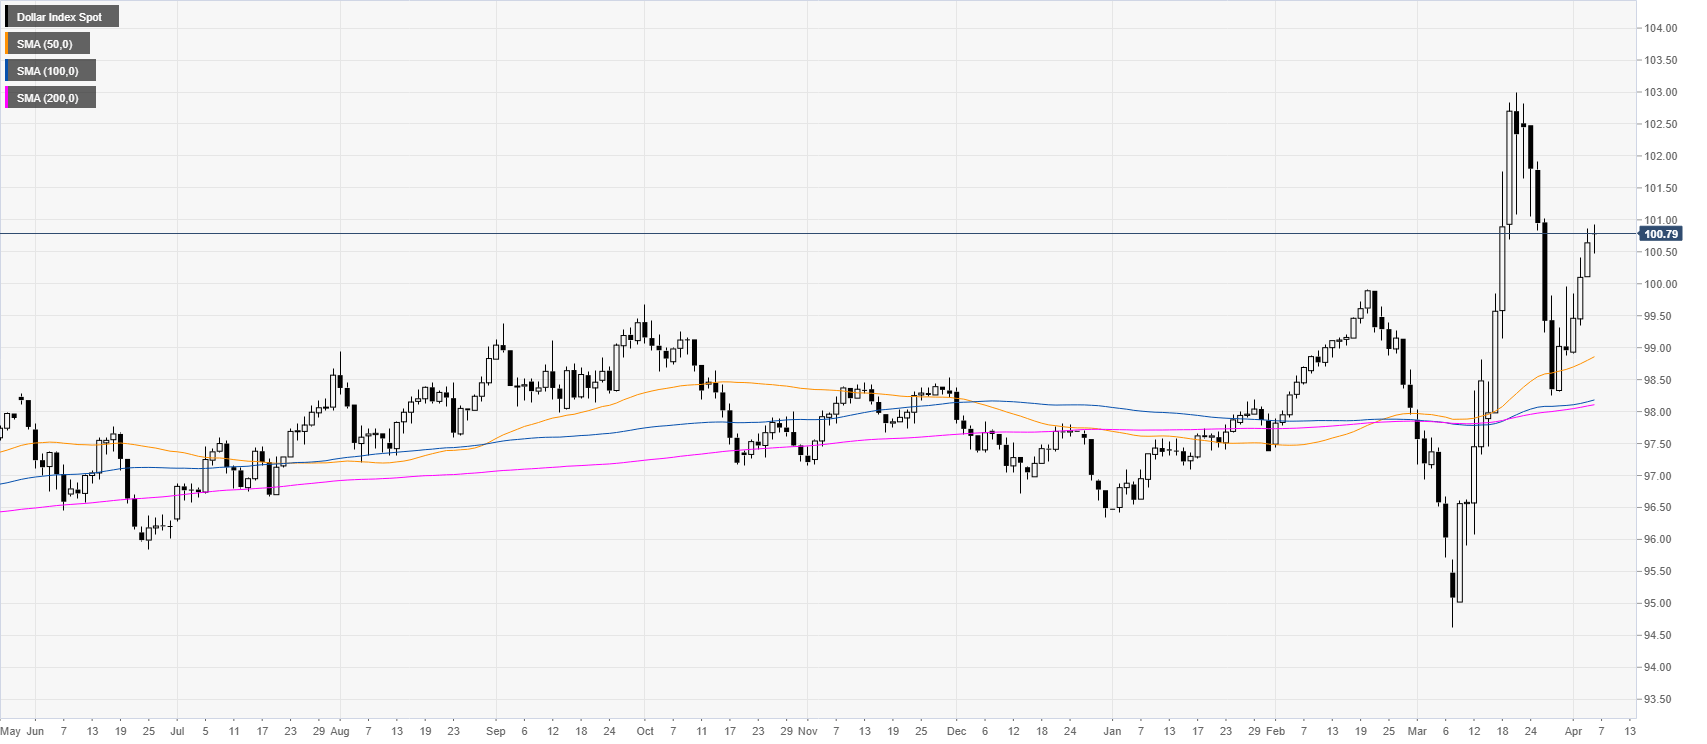
DXY daily chart
DXY is trading in a bull trend above its main daily SMAs as DXY is starting the week mixed although holding onto last week’s gains.
DXY four-hour chart
DXY is trading above the 100.50 level and its main SMAs on the four-hour chart suggesting a bullish bias in the medium term. Bulls would be looking for an extension up with the 101.00 figure as first hurdle to overcome followed by the 101.50 level en route to 103.00, the 2020 highs. On the flip side, support could emerge near the 101.50, 101.00 and 99.50 levels on any pullbacks.
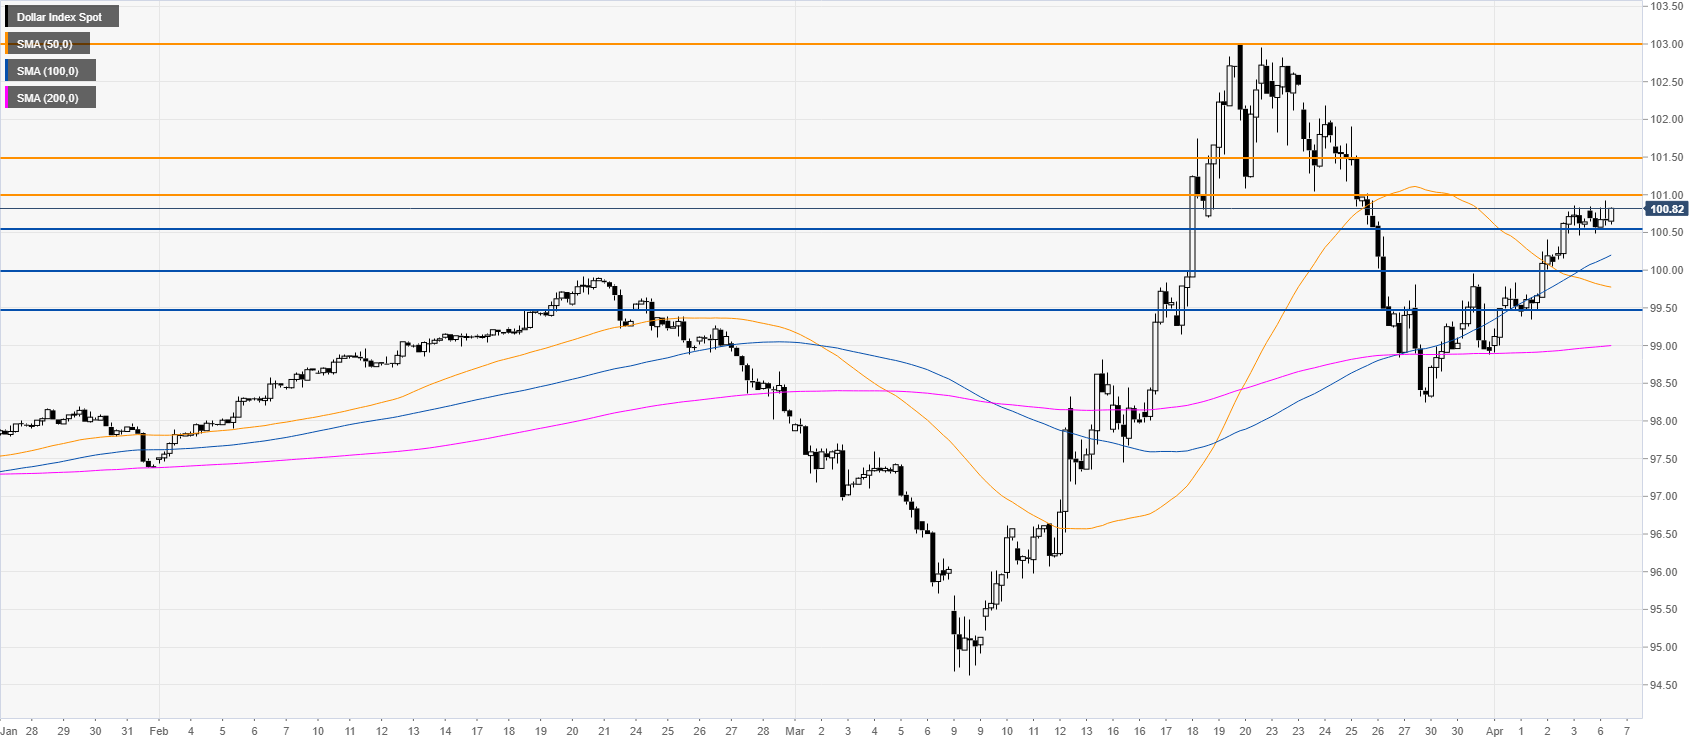
Additional key levels
