- Gold steps back from the short-term resistance line.
- A one-week-old support line in the immediate focus of the sellers.
- 200-bar SMA, 61.8% Fibonacci retracement offers strong support.
- An upside break of resistance trend line could question March high beyond $1,700.
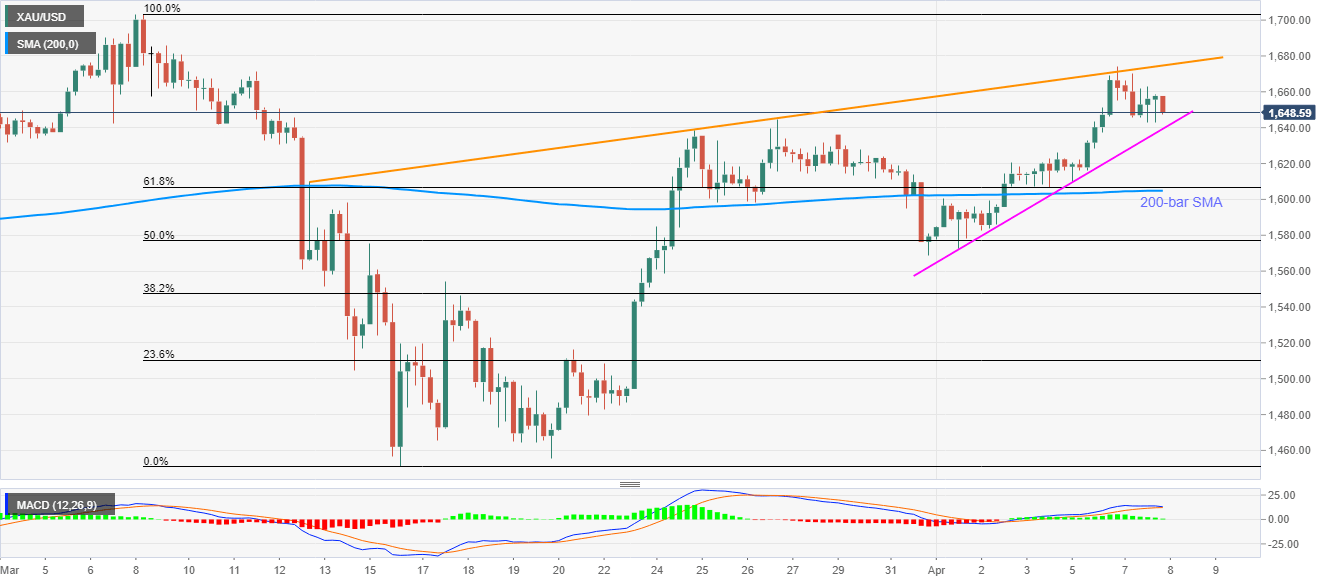
Gold prices take a U-turn from the near-term resistance trend line, stretched from March 12, while declining to $1,648 during the early Asian session on Wednesday.
With the MACD also teasing bears, the bullion may drop further towards re-testing the immediate support line, around $1,639.
Though, the metal’s additional weakness past-$1,639 could be restricted by 61.8% Fibonacci retracement of March month declines and 200-bar SMA around $1,605/07.
Alternatively, a clear break beyond $1,675 resistance line could renew buying strength towards challenging the previous month high near $1,703.
Gold four-hour chart
Trend: Pullback expected
