- USD/CAD registers three-day losing streak.
- Sustained trading below 21-day EMA, break of 50% Fibonacci retracement keep sellers hopeful.
- The support line of the monthly falling wedge could question further downside.
- Buyers will seek confirmation of the bullish pattern for fresh entry.
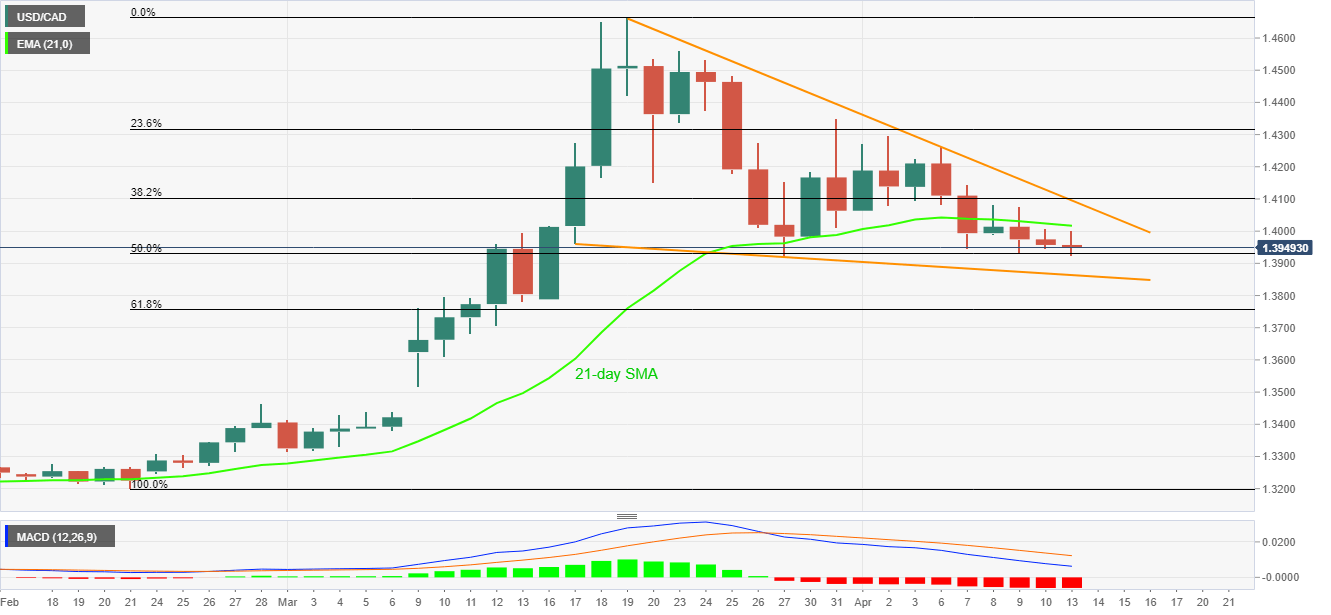
While staying below 21-day EMA for the fourth consecutive day, USD/CAD declines to 1.3945, down 0.08% on a day, during the early Monday’s trading session.
Not the only pair’s sustained trading below 21-day EMA but bearish MACD and the recent drop below 50% Fibonacci retracement of February-March upside also favor the sellers.
However, a support line of the four-week-old falling wedge formation, near 1.3865, could keep the pair’s further downside limited, if not 61.8% Fibonacci retracement level of 1.3755 will return to the charts.
On the upside break of the 21-day EMA level of 1.4020, buyers will wait for the confirmation of the bullish chart pattern, which requires a successful break above 1.4100, for fresh entry.
USD/CAD daily chart
Trend: Further weakness expected
