- Nasdaq is up more than 61.8% since the coronavirus collapse.
- The level to beat for bulls is the 9000 resistance.
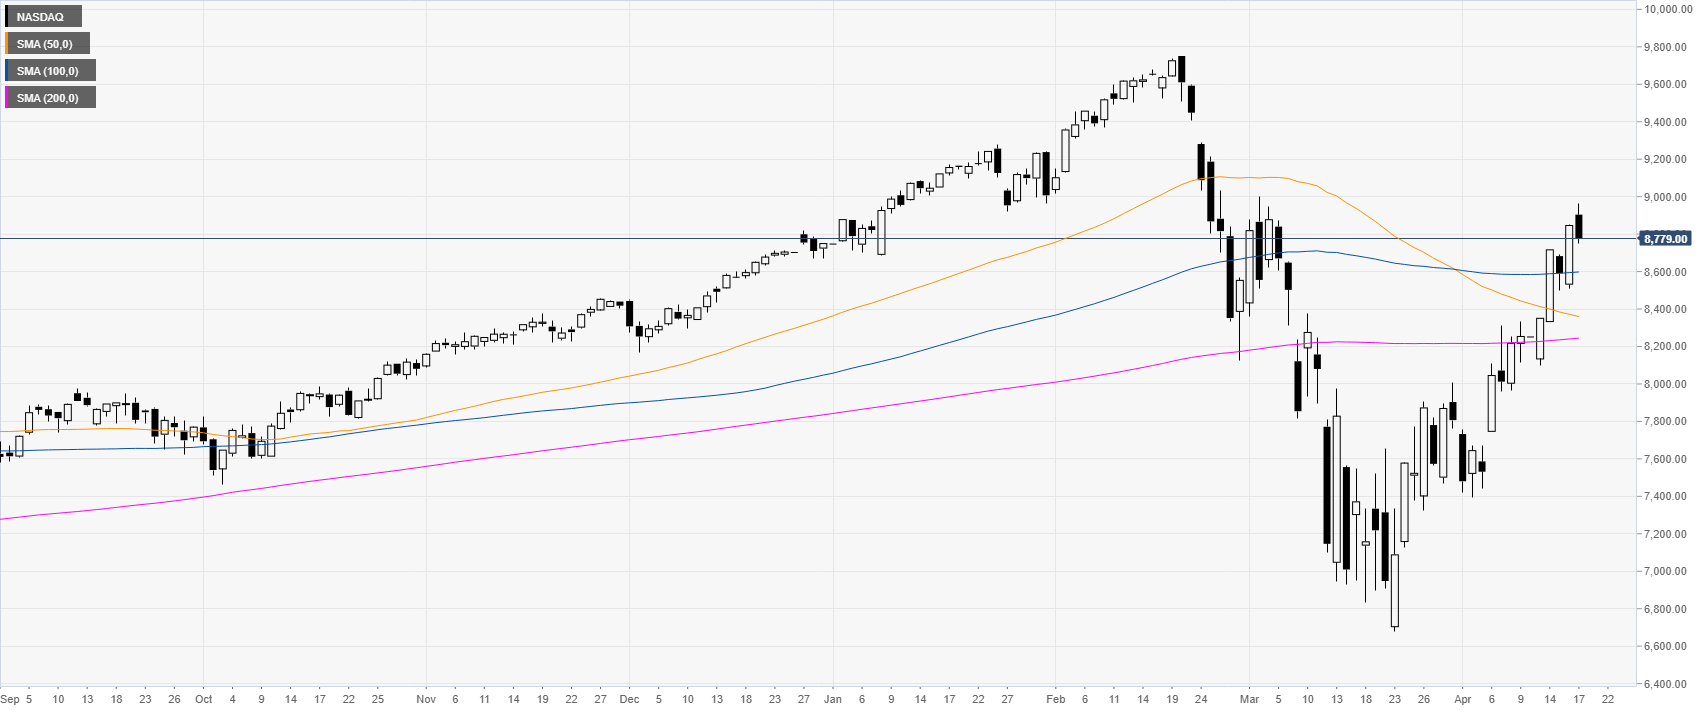
Nasdaq daily chart
After the coronavirus-related crash, the Nasdaq is bouncing up sharply trading above the 61.8% Fibonacci retracement and above its main SMAs on the daily chart.
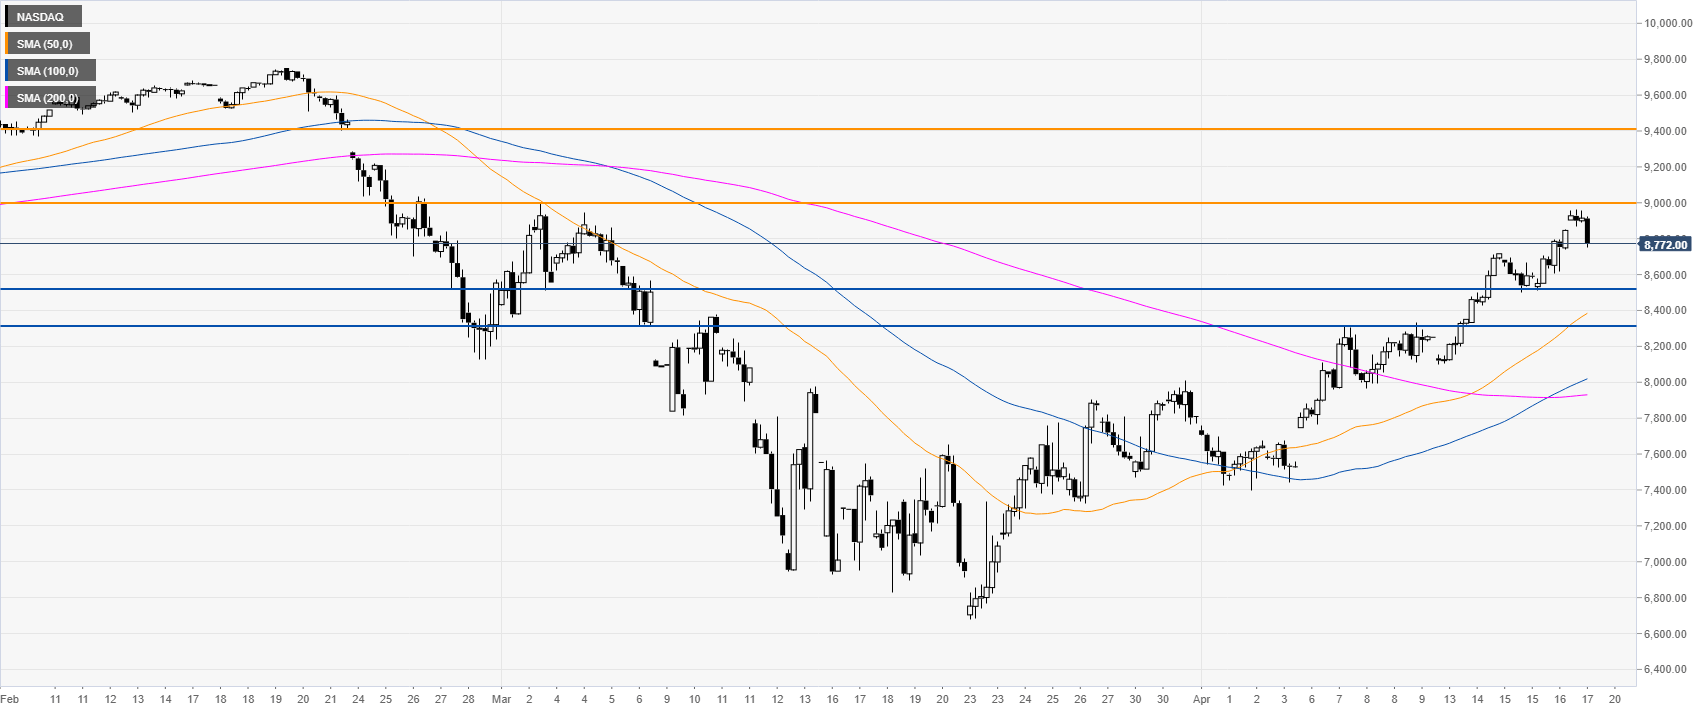
Nasdaq four-hour chart
The Nasdaq remains firmly bullish above its main SMAs on the four-hour time frame while making higher highs and higher lows suggesting that the recovery stays for now intact. The market is currently pulling back down failing to break above the 9000 round number. However, given the current strength, it seems reasonable to expect the bulls breaking this resistance sooner rather than later. Immediate support can be expected near the 8520 level.
Additional key levels
