- US dollar index (DXY) ends the week mixed below the 100.00 mark.
- The level to beat for bulls is the 100 resistance.
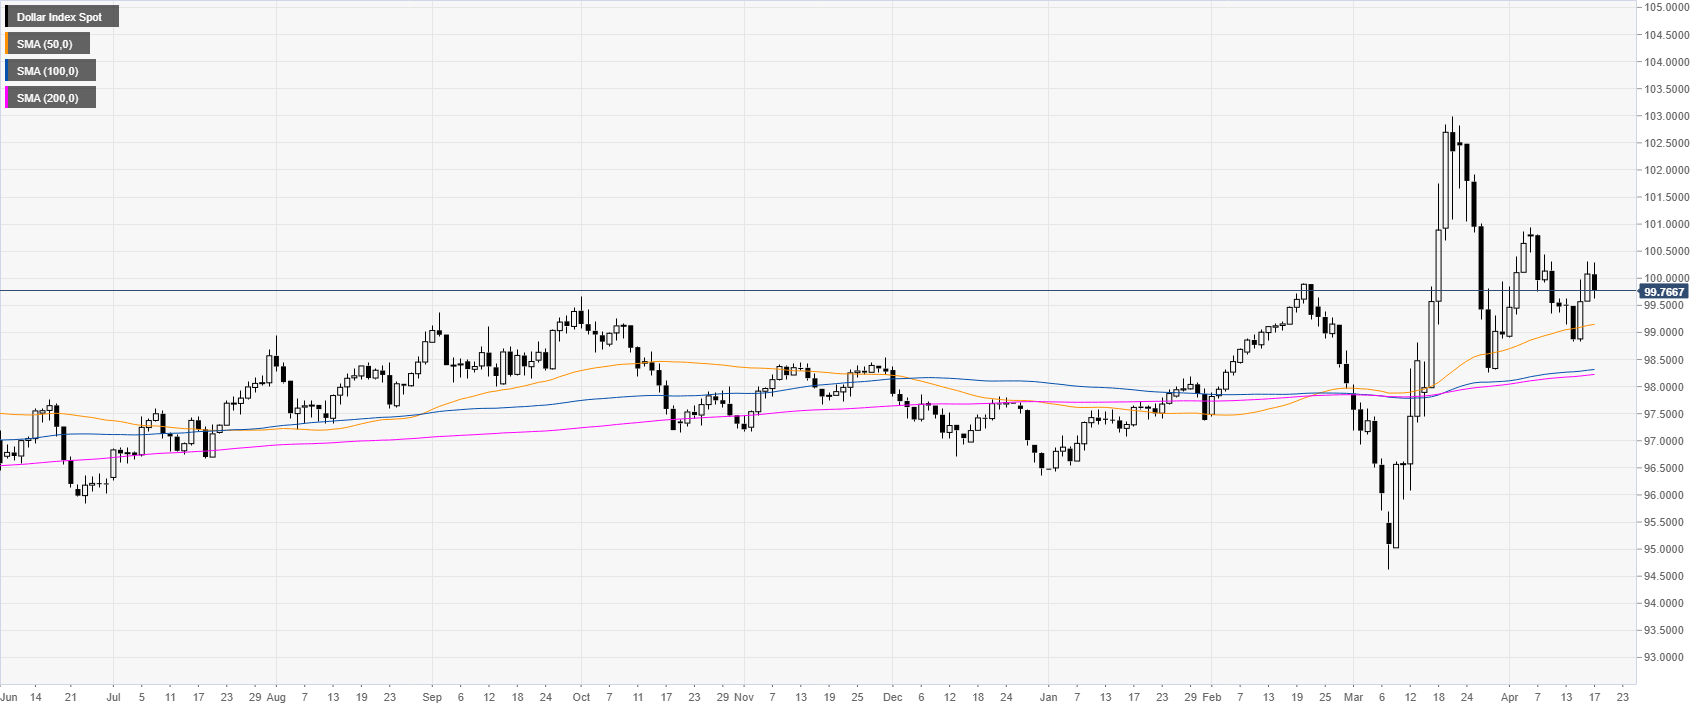
DXY daily chart
DXY is trading above the main SMAs on the daily chart on track to end the week below the 100.00 mark.
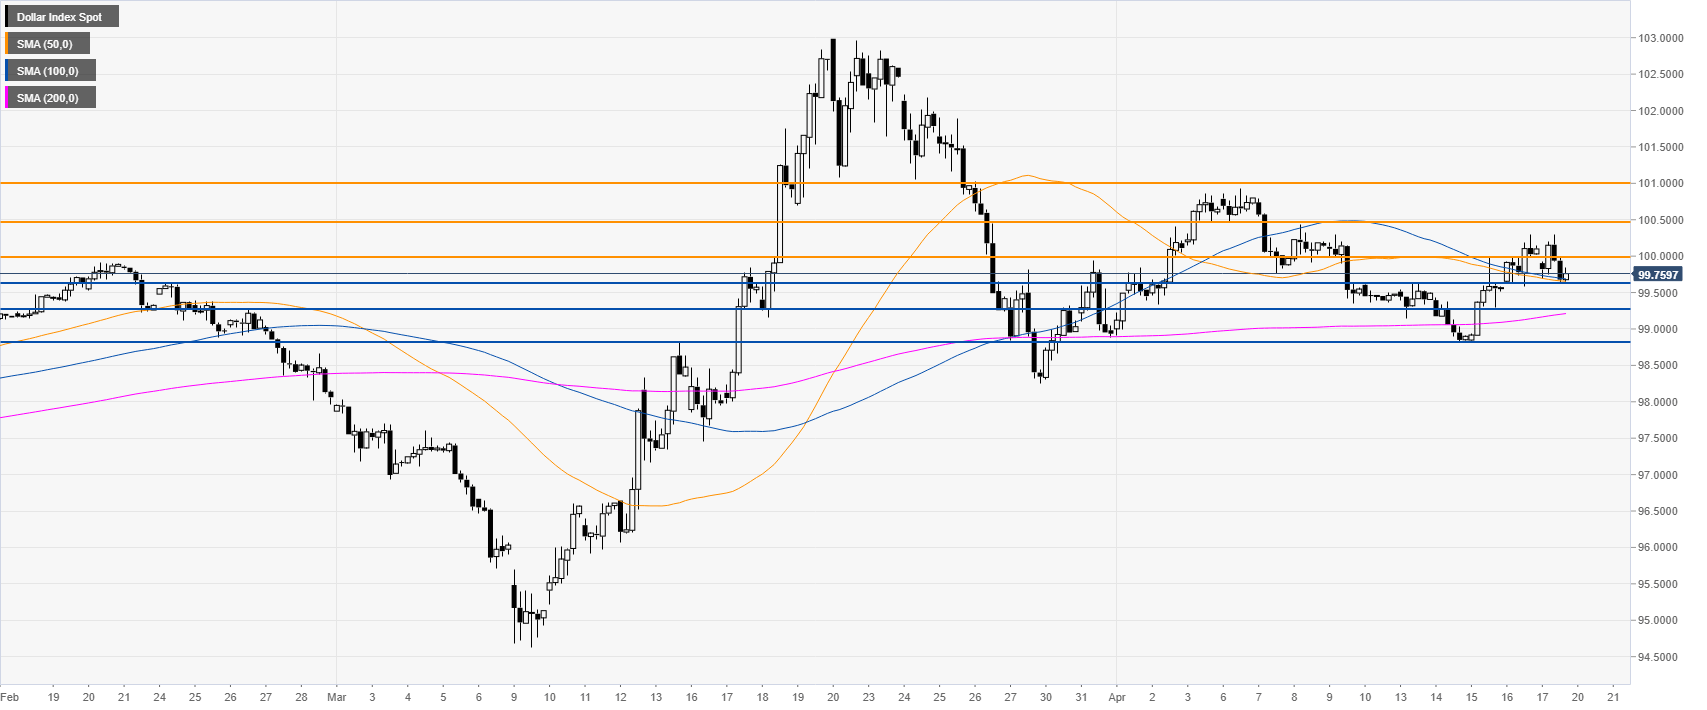
DXY four-hour chart
DXY retreats within range while trading above the main SMAs on the four-hour chart. The bull trend remains intact suggesting that next week the greenback can have a retest of the 100 figure with the potential of a break above it opening the door to further advances toward the 100.50 and 101.00 price levels. Support is expected to hold near 99.60, 99.25 and 98.85 levels.
Additional key levels
