- EUR/JPY stays under selling pressure as the new week is kicking off.
- The level to beat for sellers is the 116.90 support.
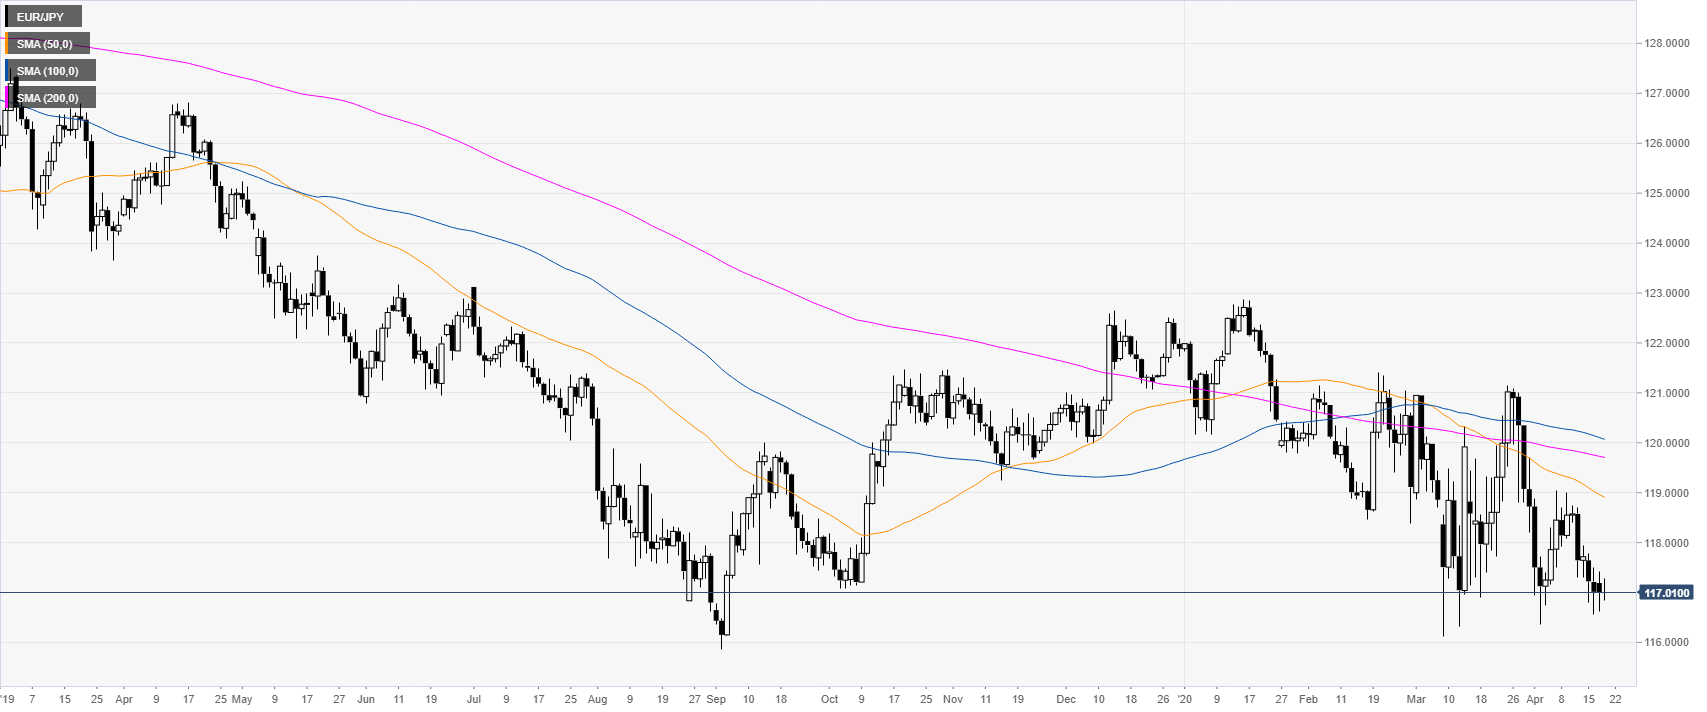
EUR/JPY daily chart
EUR/JPY remains under heavy selling pressure below the main SMAs (simple moving averages) on the daily chart as the currency cross is hovering near the 2020 lows currently located at the 116.12 level.
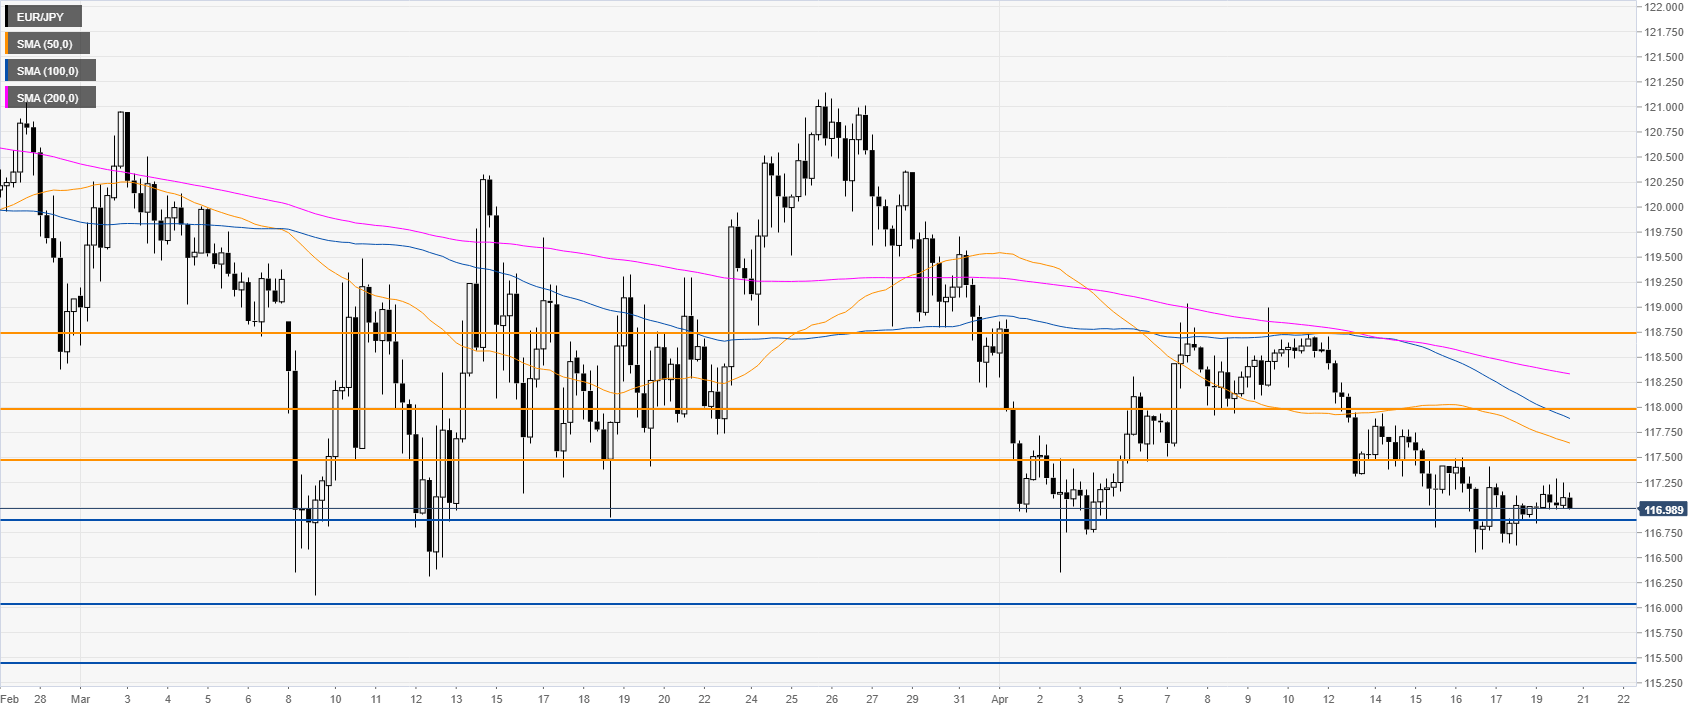
EUR/JPY four-hour chart
EUR/JPY is trading below the main SMAs on the four-hour time frame suggesting a negative bias in the medium term. The spot is about to challenge the 116.90 support level and a break below it could lead to further bearish traction towards the 116.00 and 115.45 price levels. Conversely, resistance can emerge near the 117.50 and 118.00 level near the 50 SMA.
Additional key levels
