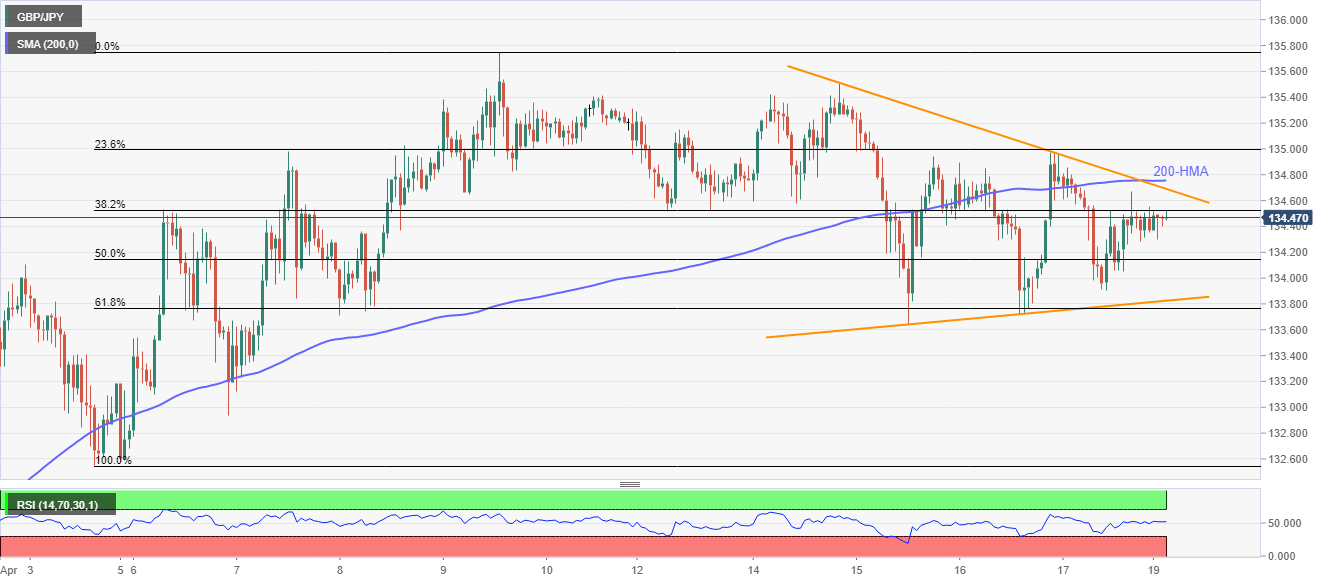
- GBP/JPY stays modestly changed inside a four-day-old symmetrical triangle.
- An upside clearance of 200-HMA could challenge the monthly top.
- 61.8% Fibonacci retracement adds filters to the downside.
GBP/JPY takes rounds to 134.45, up 0.06% on a day, amid the Asian session on Monday. In doing so, the pair stays inside a short-term symmetrical triangle below 200-HMA.
While a higher low formation since Friday favors the pair’s upside attempts, buyers will wait for a clear break of 200-HMA level of 134.75, after the break of the said triangle’s resistance line near 134.70, before taking entries.
Following that, the monthly top surrounding 135.75 will appear on the bulls’ radars.
Meanwhile, the triangle’s support and 61.8% Fibonacci retracement of the pair’s run-up between April 03 and April 09 could question the sellers around 133.82/76.
GBP/JPY hourly chart
Trend: Sideways
