- US dollar index (DXY) ends the day near the 100.00 mark.
- The level to beat for bulls is the 100 resistance.
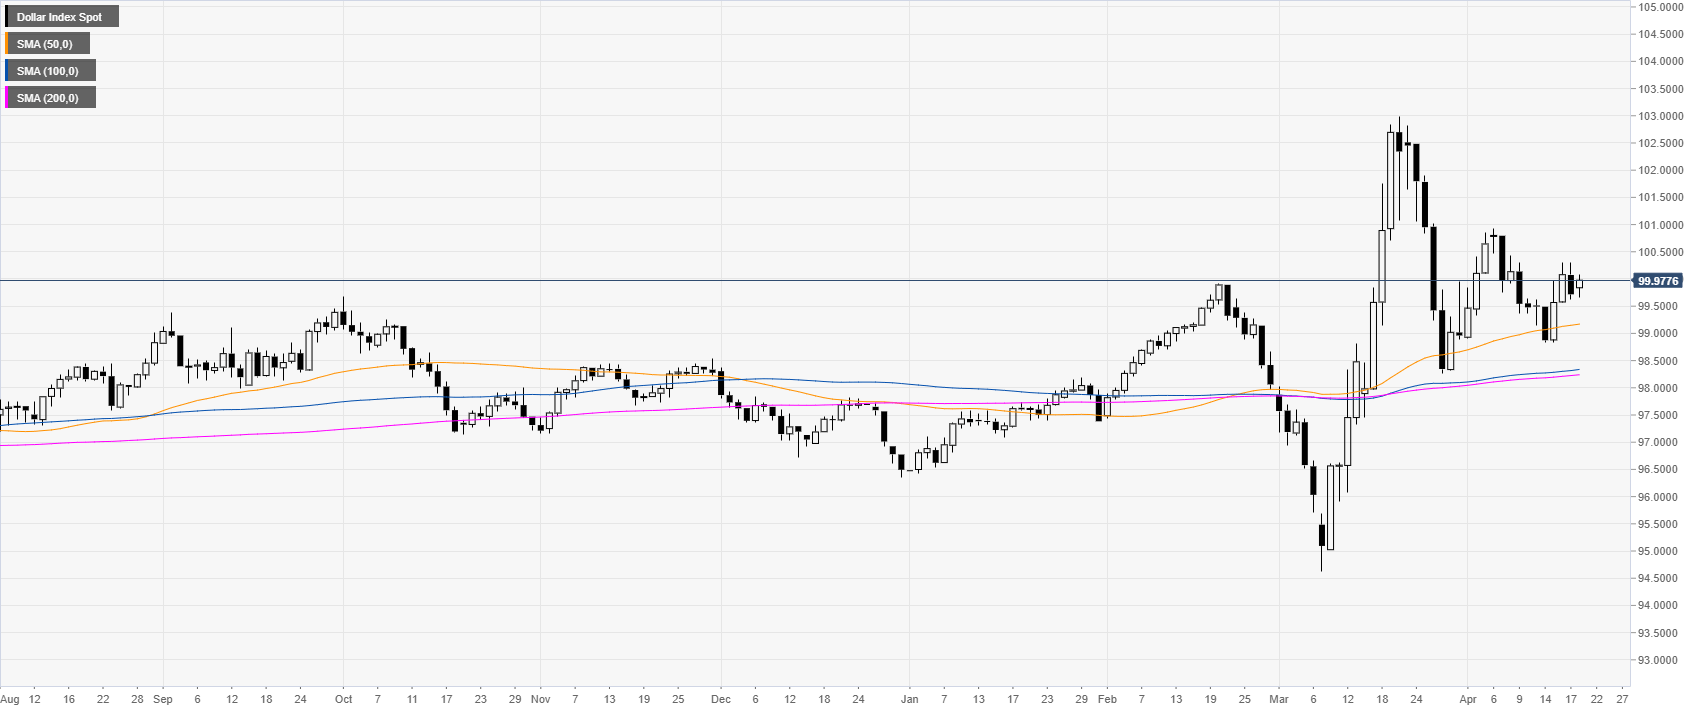
DXY daily chart
DXY is trading above the main SMAs on the daily chart as the index has been confined in a small range in the last three sessions.
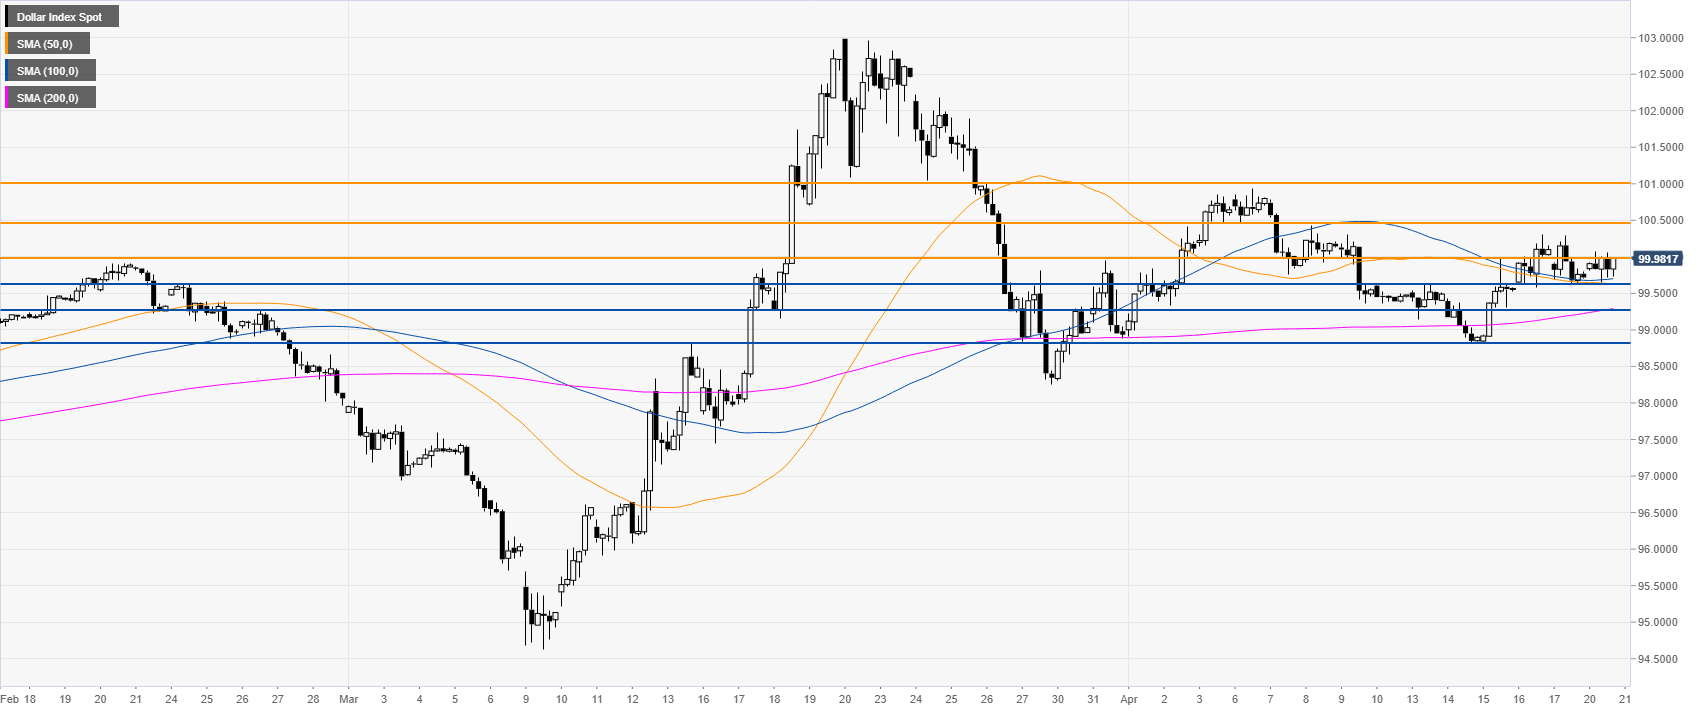
DXY four-hour chart
DXY is sidelined above the main SMAs on the four-hour chart. The uptrend remains intact suggesting that the greenback can have a potential break above the 100 figure opening the door to further advances toward the 100.50 and 101.00 price levels. Support can emerge near 99.60, 99.25 and 98.85 levels.
Additional key levels
