- GBP/USD remains weak inside a three-day-old trading range.
- 100-HMA offers the intermediate resistance, 61.8% Fibonacci retracement adds to the support.
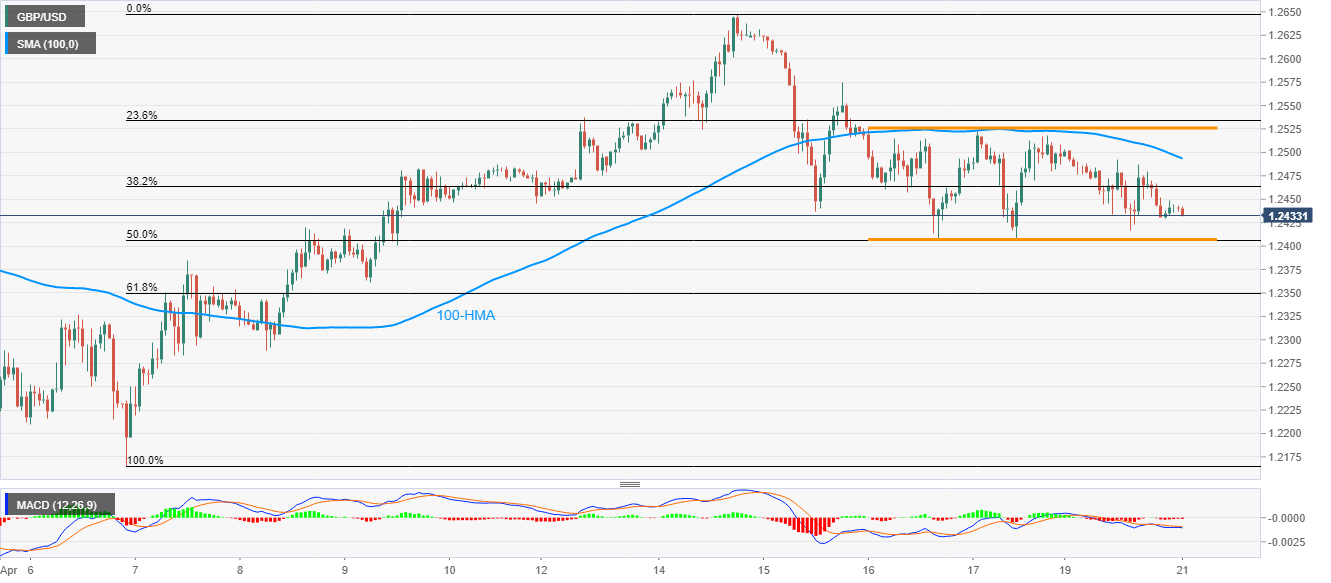
GBP/USD drops to 1.2431 amid the early Asian session on Tuesday. Even so, the pair remains between the ranges established since last Thursday amid bearish MACD.
As a result, the range support, also comprising 50% Fibonacci retracement of April 06-14 upside, around 1.2405, becomes the immediate rest-point to watch during the pair’s further declines.
Should there be a further downside below 1.2405, 61.8% Fibonacci retracement level of 1.2350 and April 08 low near 1.2290 will flash on the bears’ radars.
Meanwhile, a 100-HMA level of 1.2495 could restrict the pair’s immediate recovery moves ahead of the said range’s resistance, near 1.2525.
In a case where the quote manages to cross 1.2525, 1.2575 and the monthly top near 1.2645/50 will lure the buyers.
GBP/USD hourly chart
Trend: Sideways
