- USD/JPY remains mildly positive inside a short-term trading range.
- Buyers will aim for 108.60 beyond 200-HMA.
- Bears can attack the monthly low following the downside break of the triangle.
While struggling between the broad US dollar strength and the safe-haven allure of the Japanese yen, USD/JPY registers mild gains, of 0.10% on a day, as taking rounds to 107.70 during the initial hours of Tokyo open on Tuesday.
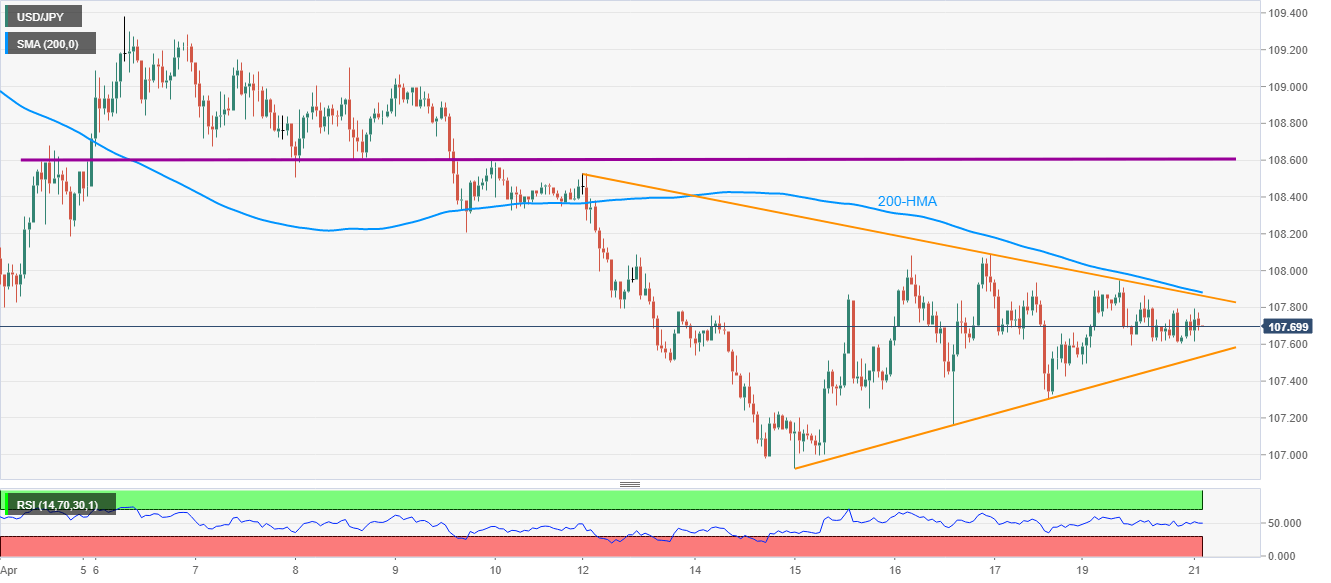
The pair stays inside the weekly symmetrical triangle, as well as below 200-HMA, at present.
Hence, buyers are likely to enter the trade beyond 107.85/90 resistance confluence, comprising the pattern’s upper line and 200-HMA, whereas sellers may cheer the break below 107.50.
During the quote’s run-up beyond 107.90, a horizontal resistance, established since early-April, around 108.60, will be on the bulls’ radars.
On the contrary, 107.20 and 106.90 could entertain the bears during the pair’s downside below 107.50. Though, a sustained weakness past-106.90 will set the tone for the quote’s slump to March 10 high near 105.90.
USD/JPY hourly chart
Trend: Sideways
