- NZD/USD registers mild gains following its pullback from the immediate triangle support.
- The monthly top can lure buyers on the upside break of the triangle.
- A 0.5850 mark will flash on the bears’ radars once the triangle break to the downside.
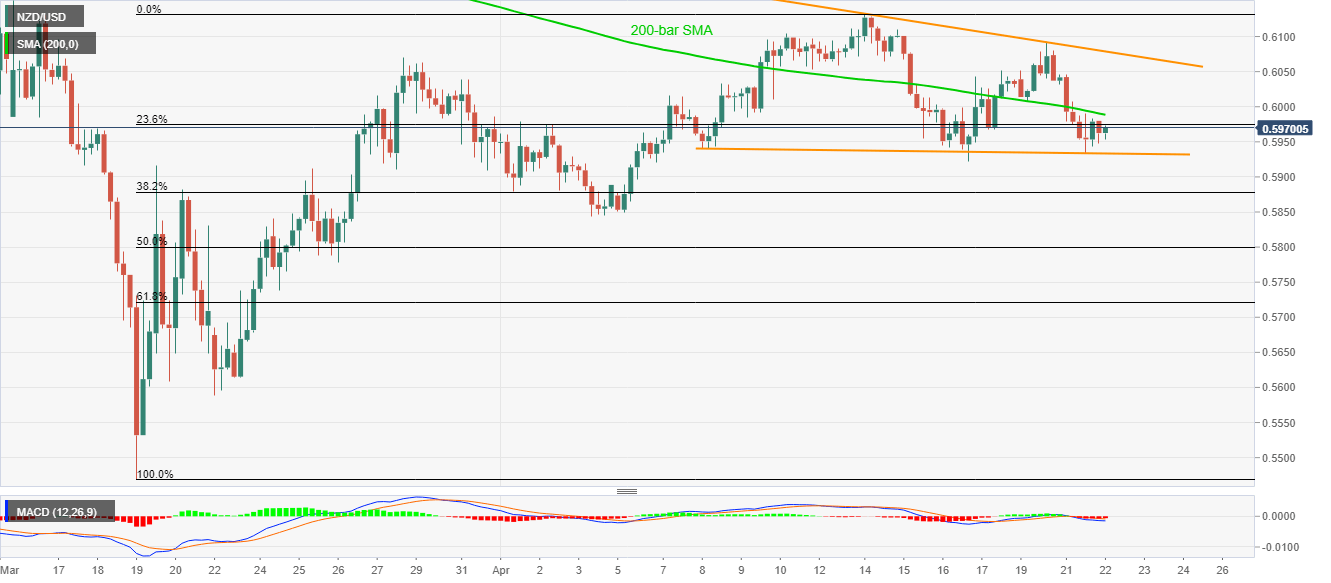
NZD/USD marks 0.10% gains to 0.5965 during the early Wednesday’s trading session. While the pullback is more likely due to the support line of the short-term triangle, 200-bar SMA guards the pair’s immediate upside.
Other than 0.5990 immediate resistance, comprising 200-bar SMA, buyers will have to cross the upper line of the said triangle, currently near 0.6080, ahead of probing the monthly tops surrounding 0.6130.
Alternatively, a downside break below 0.5930 triangle support could trigger fresh declines targeting the early-month bottoms near 0.5850.
It’s worth mentioning that the sustained trading below key SMA and bearish MACD favors the sellers.
NZD/USD four-hour chart
Trend: Bearish
