- GBP/USD fails to extend the recovery moves.
- A monthly support line, five-week-old horizontal line check sellers.
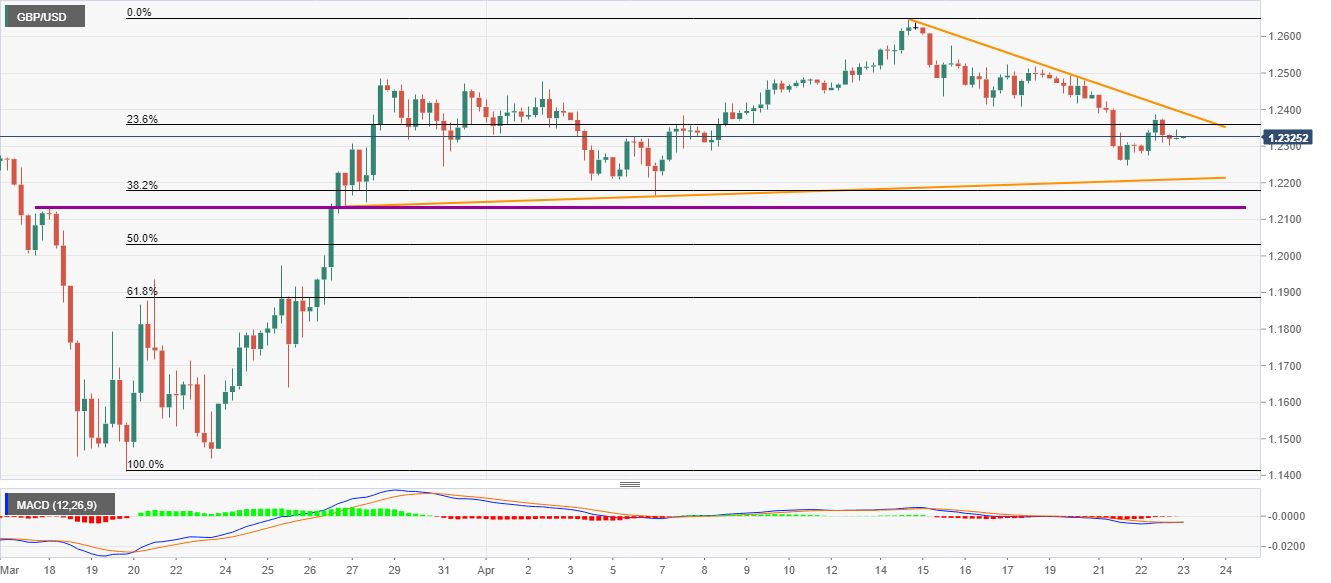
- 1.2490 adds to the resistance ahead of the monthly top.
GBP/USD drops 0.10% on a day, to currently near 1.2320, amid the early Asian session on Thursday. In doing so, the pair fails to extend the previous day’s recovery moves as portrayed by a seven-day-old falling trendline.
Given the pair’s sustained weakness, an upward sloping trend line since March 27, around 1.2210, seems to be the immediate support.
However, a horizontal line since March 18, close to 1.2130 could question the pair’s further downside past-1.2210.
On the upside, multiple stops around 1.2490 can check buyers following a clear break of the said resistance line, at 1.2395 now.
In a case where the GBP/USD prices remain strong above 1.2490, the monthly high of 1.2648 will be challenged afterward.
GBP/USD four-hour chart
Trend: Further weakness expected
