- USD/JPY struggles to move in Asia.
- Either side break of the triangle can quickly challenge the monthly high/low.
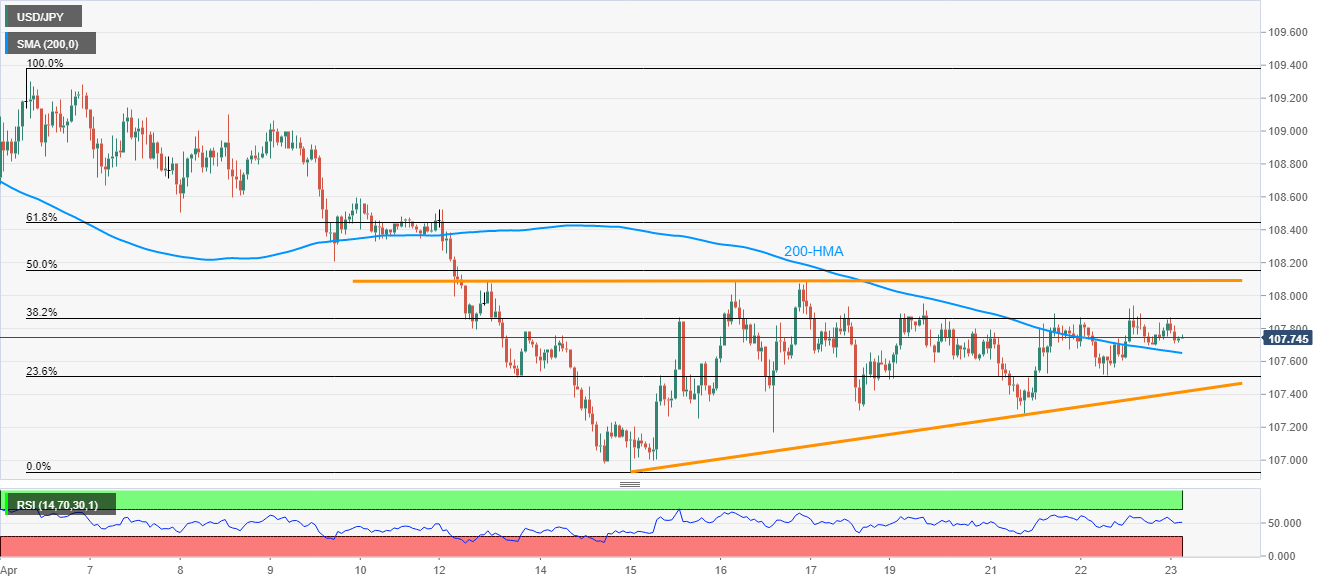
- A sustained break above 200-HMA keeps the buyers hopeful.
USD/JPY registers dormancy while taking rounds to 107.76, above 200-HMA, during the early Thursday. In doing so, the pair stays inside an eight-day-old ascending triangle formation.
With sustained trading above 200-HMA, coupled with the normal RSI conditions, USD/JPY prices are inching closer to pierce the formation resistance, currently at 108.10.
Should there be a clear break above 108.10, 108.60 and 109.10 can offer intermediate halts during the pairs’ run-up to challenge the monthly top surrounding 109.30.
On the flip side, pair’s trading below 200-HMA level of 107.65 needs to slip under the triangle’s support of 107.40 to aim for the monthly low near 106.90.
USD/JPY hourly chart
Trend: Sideways
