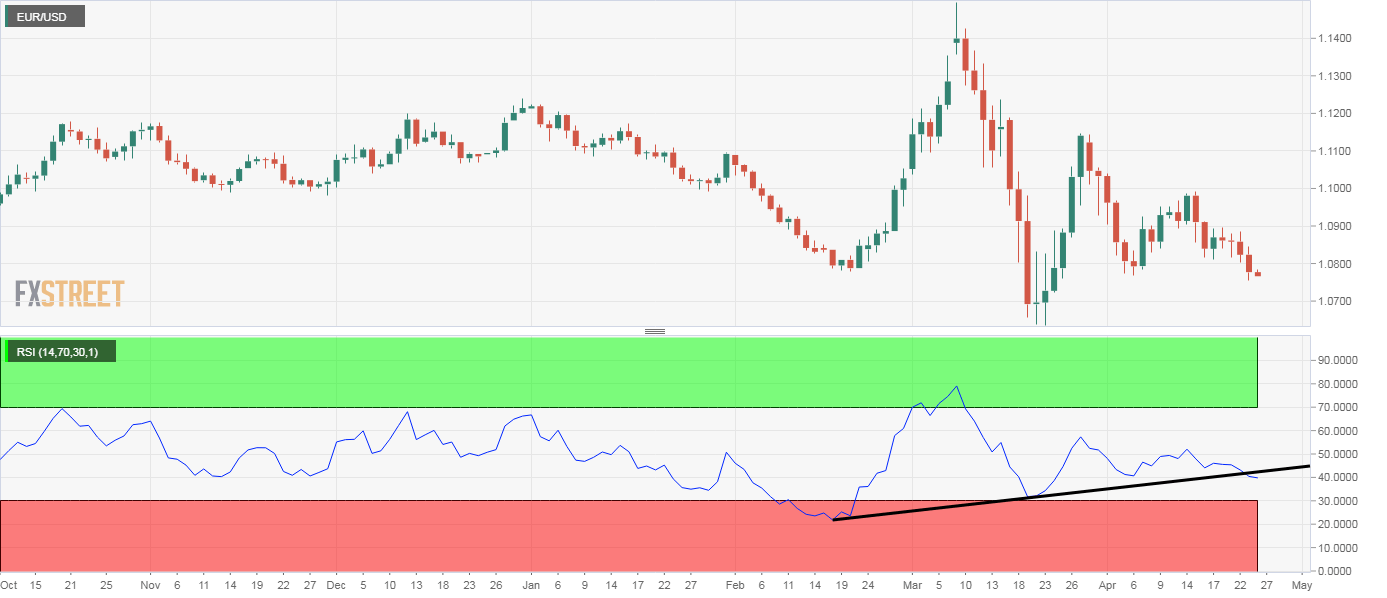
- EURUSD’s daily chart RSI shows the strongest bearish bias in four weeks.
- Bearish price patterns suggest scope for a re-test of 2020 lows.
EUR/USD is on the offer for the third straight day on Friday with the widely-followed 14-day relative strength index reporting strongest bearish conditions in four weeks.
The indicator is seen at 40 near press time, the lowest level since March 24. A below-50 reading indicates the bears are in control.
Meanwhile, the 4-hour chart shows the pair dived out of a sideways channel on Wednesday, revising the bearish view put forward by the contracting triangle breakdown on April 16.
The spot is not flirting with the support at 1.0768 – the higher low on the 4-hour chart created on April 6.
That level will likely be breached, opening the doors for a re-test of the March 22 low of 1.0636. A close above 1.0897 (April 20 high) would invalidate the immediate bearish view.
4-hour chart
Trend: bearish
Technical levels
