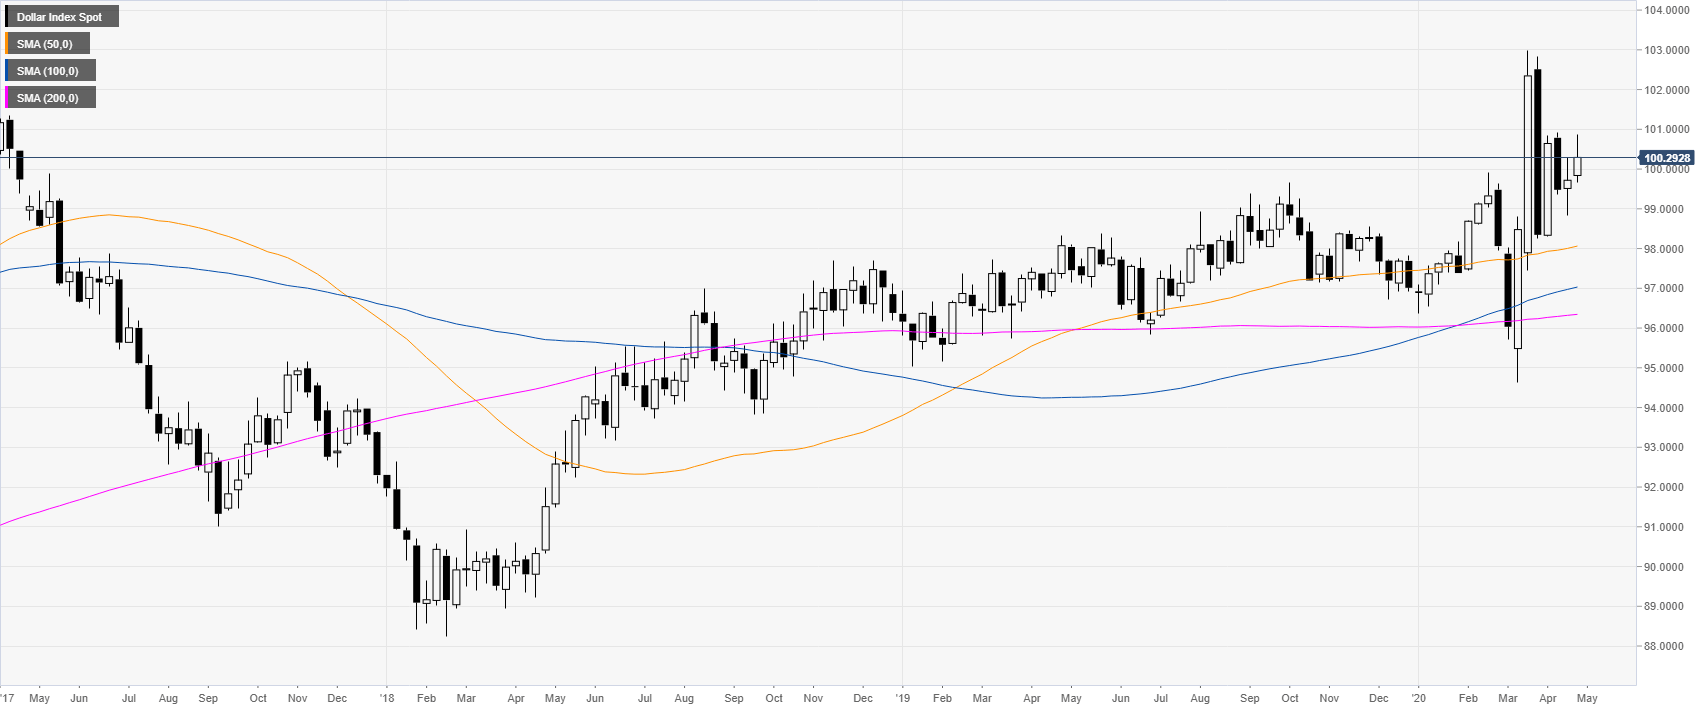
- US dollar index (DXY) ends the week above the 100.00 mark.
- The level to beat for bulls is the 100.50 resistance.
DXY weekly chart
DXY is trading above the weekly SMAs suggesting an overall bullish bias. The greenback is about to end the week above the 100.00 mark.
DXY four-hour chart
DXY is having a small dip below the 100.50 level while holding above the main SMAs. The bulls trend remains intact however bulls need to regain the 100.50 level to create a clear break above the 101.00 figure. Support can emerge near the 100.00 figure followed by the 99.60 level.
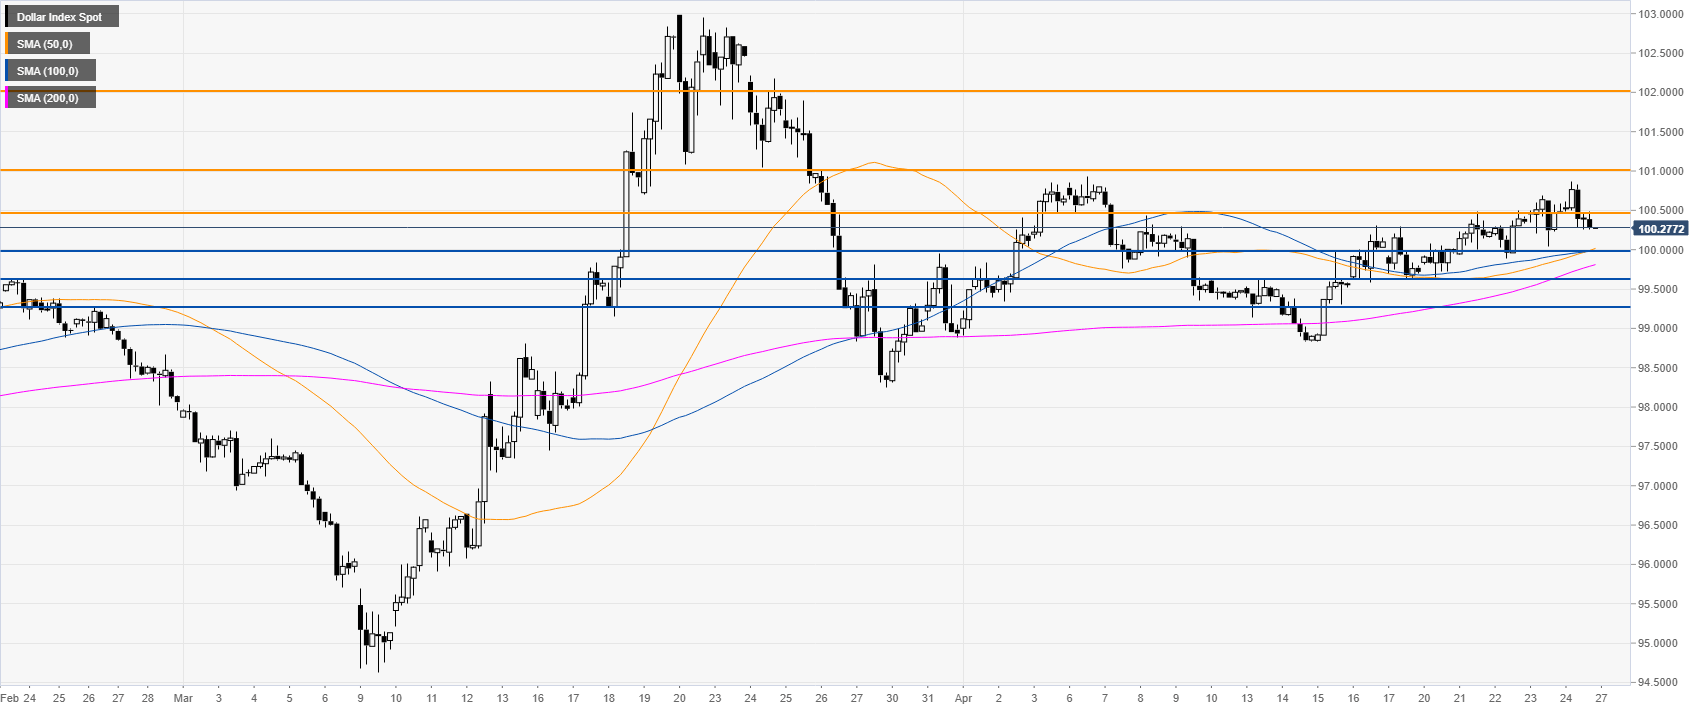
Additional key levels
