- USD/IDR pulls back from the multi-day low, still in the red.
- 21/50-day EMA restrict immediate moves.
- A two-week-old falling trend line, 61.8% Fibonacci retracement add to the support.
Despite bouncing off the multi-day low, USD/IDR marks 0.10% loss while taking rounds to 14,585 during the initial Indonesian session on Monday.
Even so, the pair stays between 21-day and 50-day EMAs, respectively around 15,645 and 15,300.
While bearish MACD favors the sellers, 50% Fibonacci retracement of March month upside, around 15,360, as well as a short-term falling trend line, close to 15,180, act as additional supports to watch.
On the upside, a clear break above 15,645 will trigger the pair’s run-up towards 16,000 and then to late-March low surrounding 16,100.
USD/IDR chart
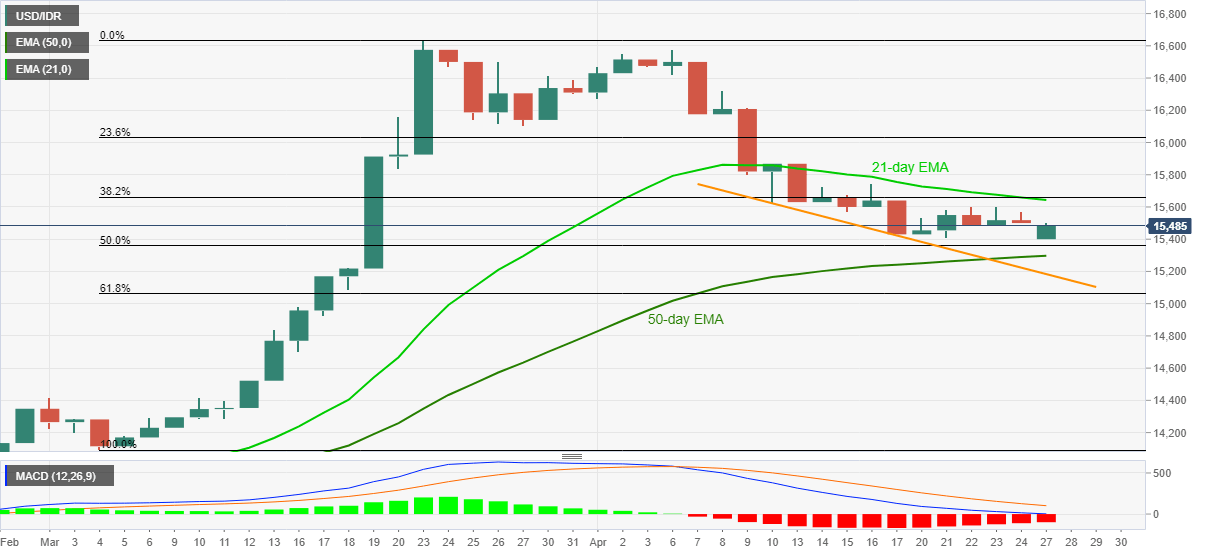
Trend: Bearish
