- USD/JPY registers mild gains inside a short-term descending triangle.
- 200-day SMA adds to the resistance before the monthly top.
- 50% and 60% Fibonacci retracements limit downside past-triangle support.
Despite defying the previous three-day losing streak, USD/JPY registers mild gains of 0.05% while making rounds to 107.55 amid the early Monday’s trading session.
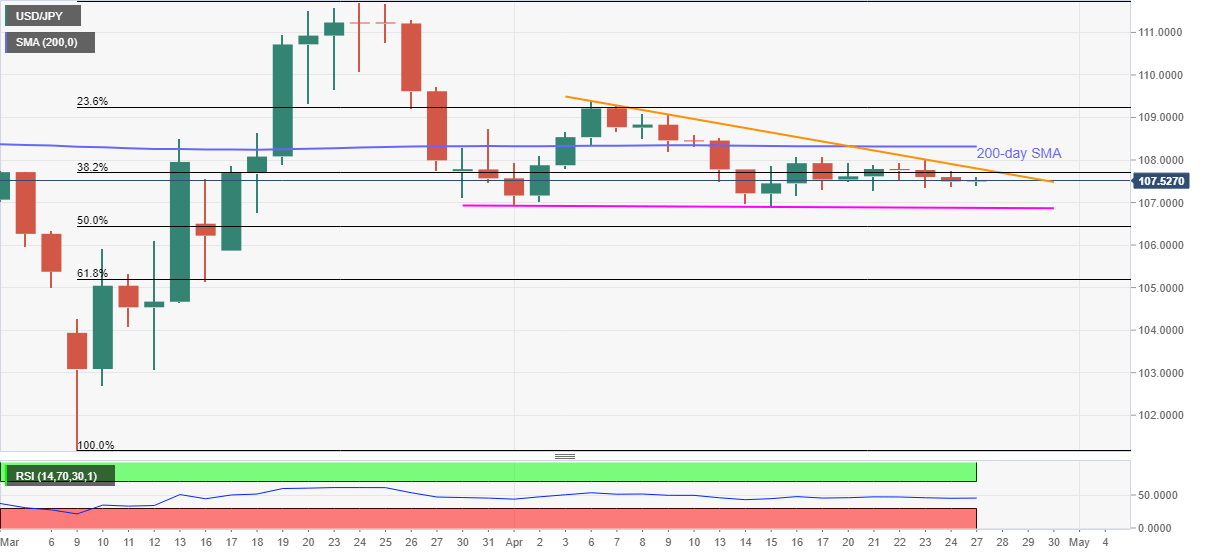
38.2% Fibonacci retracement of March month upside and the resistance line of the monthly triangle restrict the pair’s near-term upside respectively around 107.70 and 107.80.
Also acting as an upside barrier is 200-day SMA, currently near 108.30, which holds the key to the pair’s run-up towards the monthly high of 109.40.
Meanwhile, the pair’s declines below the triangle support of 106.90 will have 50% and 61.8% Fibonacci retracement levels of 106.45 and 105.20 as follow-on rest-points.
If at all the bears manage to dominate past-105.20, 103.00 will return on their radars.
USD/JPY daily chart
Trend: Sideways
