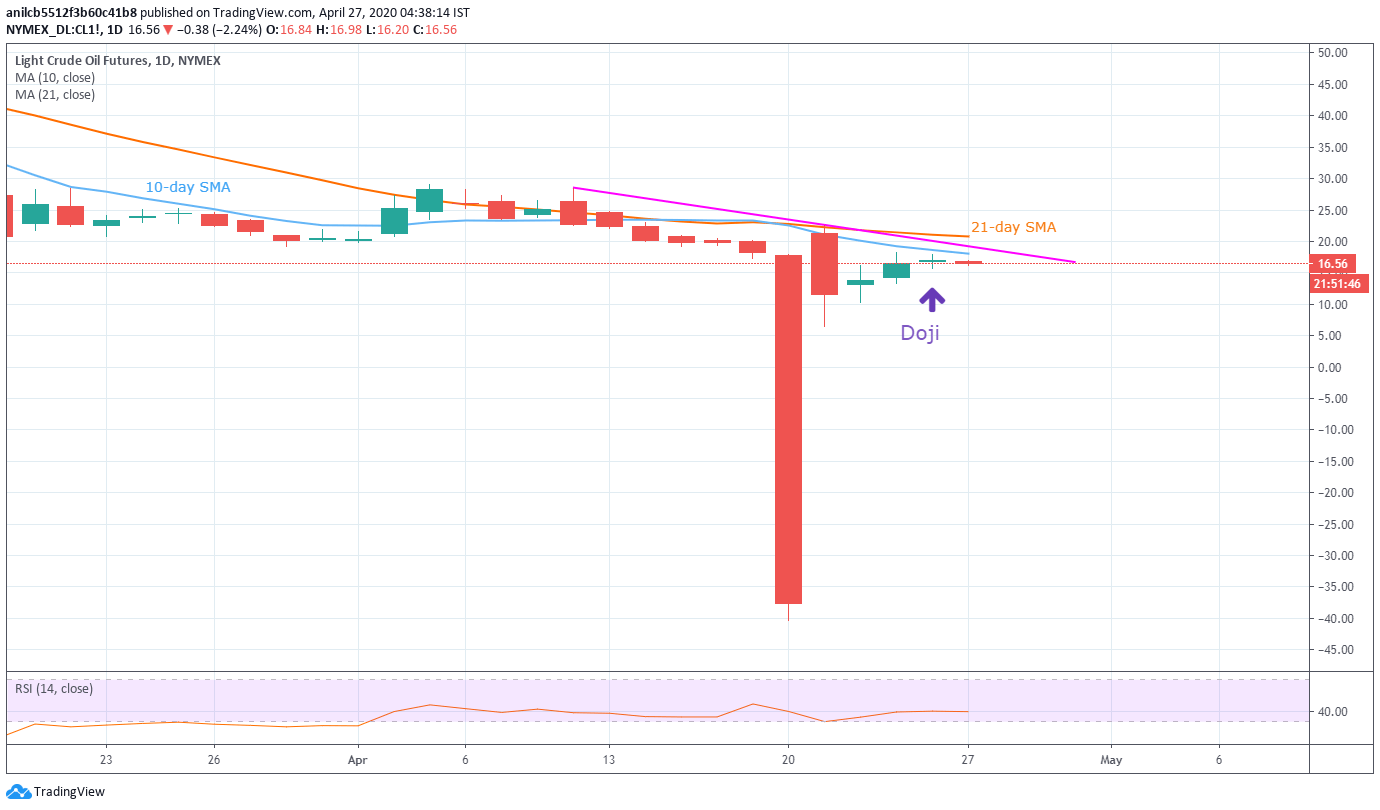
- WTI snaps three-day winning streak after a trend-reversal suggestion candlestick formation on Friday.
- 10-day SMA, 12-day-old resistance line guard immediate upside.
- $10.00 holds the key to further downside.
While snapping three-day winning streak, backed by Friday’s Doji, NYMEX Crude WTI Futures for June drops to $16.70, down 1.50% during the early Monday morning in Asia.
Not only the trend-reversal signaling candlestick formation but the black gold’s sustained trading below key short-term moving averages (MAs) also portray the underlying weakness in momentum.
As a result, sellers can keep $10.00 on the radars with the Thursday’s low near $13.30 acting as immediate downside stop during the further declines.
It should, however, be noted that the quote’s weakness below $10.00 could drag it back to the sub-$7.00 area.
Meanwhile, 10-day SMA and a multi-day-old falling trend line, respectively near $18.10 and $19.05, seem to guard the energy benchmark’s immediate upside.
Also acting as a resistance beyond $19.05 will be the 21-day SMA level of $20.80.
WTI daily chart
Trend: Pullback expected
