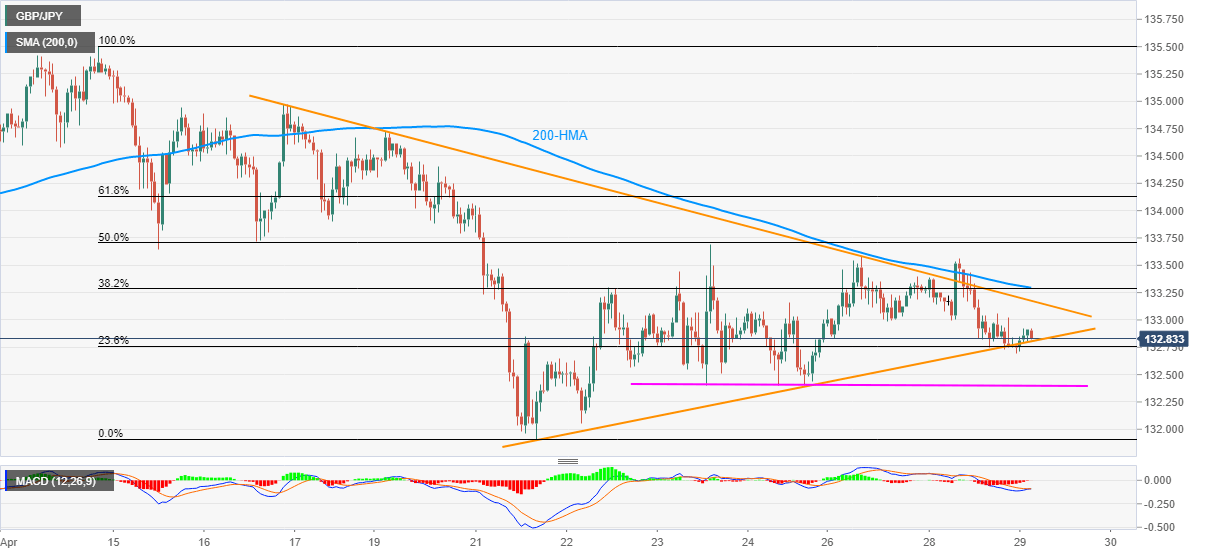
- GBP/JPY remains modestly bid following its bounce from the triangle support.
- A confluence of 200-HMA, 38.2% Fibonacci retracement adds to the resistance.
- The weekly horizontal support can check bears after a downside break of the triangle.
GBP/JPY registers modest gains of below 0.10% while taking rounds to 132.90/85 during the pre-UK trading session on Wednesday.
The pair recently bounced off a short-term symmetrical triangle’s support, which in turn propels the recovery moves towards the formation resistance line near 133.20.
While a further upside past-133.20 is less expected, a confluence of 200-HMA and 38.2% Fibonacci retracement of April 14-21 declines, near 133.30, offers an additional north-side barrier to the pair.
On the flip side, the pair’s declines below 132.80 triangle support may take a rest on the weekly horizontal support around 132.40 before visiting 132.00 round-figure.
During the pair’s further weakness past-132.00, the monthly bottom close to 131.90 and 130.00 round-figure will be the key to watch.
GBP/JPY hourly chart
Trend: Sideways
