- GBP/USD maintains the break of 21-day SMA, a seven-week-old falling trend line.
- 50-day SMA holds the gate for the further recovery towards 200-day SMA.
GBP/USD registers modest gains to 1.2435 amid Wednesday’s Asian session. Despite the pair’s latest pullback moves, it stays below a short-term falling trend line from March 09 and 21-day SMA amid mildly bullish MACD.
As a result, the buyers are set to confront a 50-day SMA level of 1.2455, a break of which could escalate the recovery moves towards 200-day SMA, currently around 1.2655.
In a case where the bulls manage to cross 1.2655 on a daily closing basis, the early-March bottom surrounding 1.2740 may return to the chart.
Alternatively, a daily closing below 1.2415/10 support confluence can drag the pair back to the previous week’s low surrounding 1.2250. Though, the monthly bottom close to 1.2165 could restrict the pair’s further downside.
GBP/USD daily chart
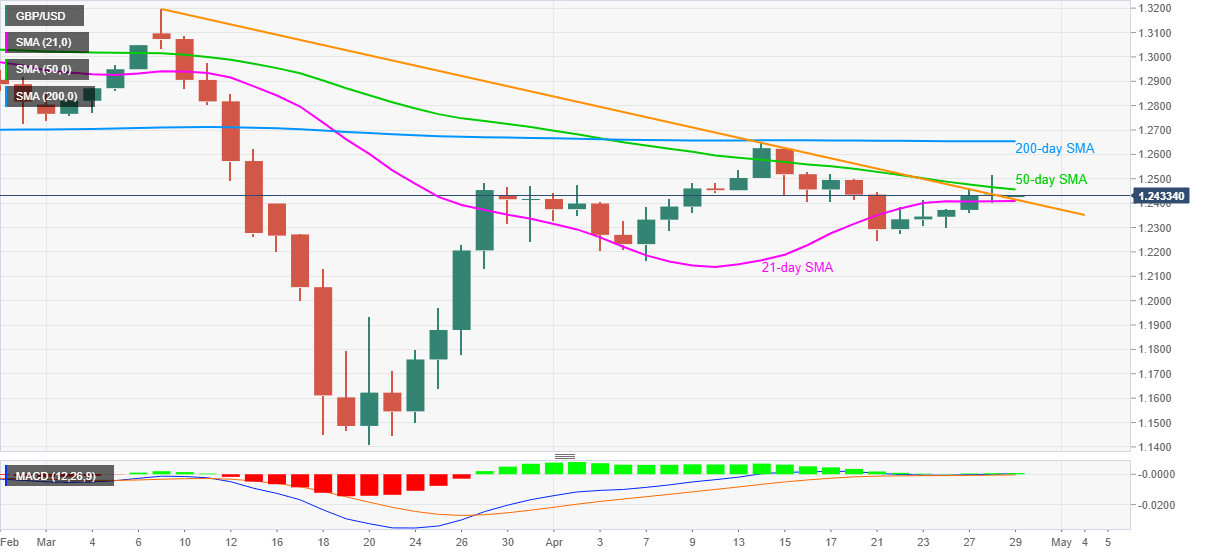
Trend: Bullish
