- NZD/USD challenges the trendline falling from Dec. 31 highs.
- A convincing breakout could invite more chart-driven buying.
NZD/USD tested the resistance of the trendline sloping downwards from Dec. 31 and Jan. 24 highs during the Asian trading hours on Thursday.
At press time, the trendline resistance is located at 0.6144 and the pair is trading at 0.6131, having hit lows under 0.55 in March.
Acceptance above the bearish trendline would open the doors for a continuation of the rally from the March low and open the doors to the 200-day average located at 0.6358.
Alternatively, a rejection at the trendline hurdle, if followed by a quick drop below 0.5910, would confirm another lower along the descending trendline and an end of the recovery rally. That would shift the risk in favor of a re-test of 0.55.
Daily chart
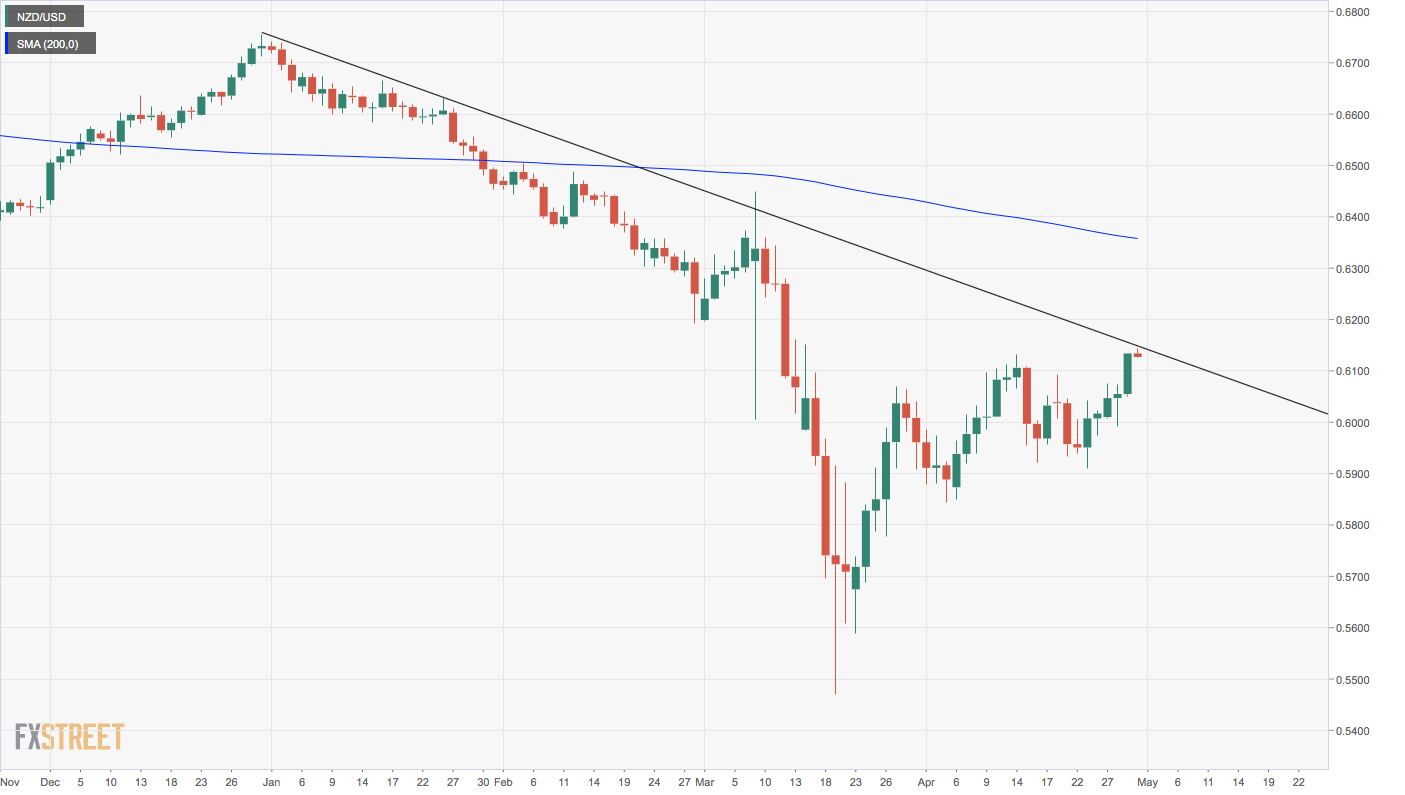
Trend: Neutral
Technical levels
