- WTI takes the bids near the weekly high.
- 200-bar SMA acts as the immediate upside barrier.
- Bullish MACD, sustained break of previous resistance line keeps buyers hopeful.
WTI June futures cheer the break of short-term resistance line, now support, while taking the bids near $17.20 ahead of the European session on Thursday.
The energy benchmark from NYMEX currently heads to 200-bar SMA level around $21.50 whereas the previous week’s top surrounding $22.60 could lure the buyers next.
If at all oil prices remain positive, as likely based on the bullish MACD, beyond $22.60, the monthly top close to $29.15 could return to the charts.
On the flip side, the black gold’s declines below the resistance-turned-support trendline, currently around $16.10, again highlights $10.00 for the sellers.
However, $13.65 and $11.80 could offer intermediate stops during the downside.
WTI four-hour chart
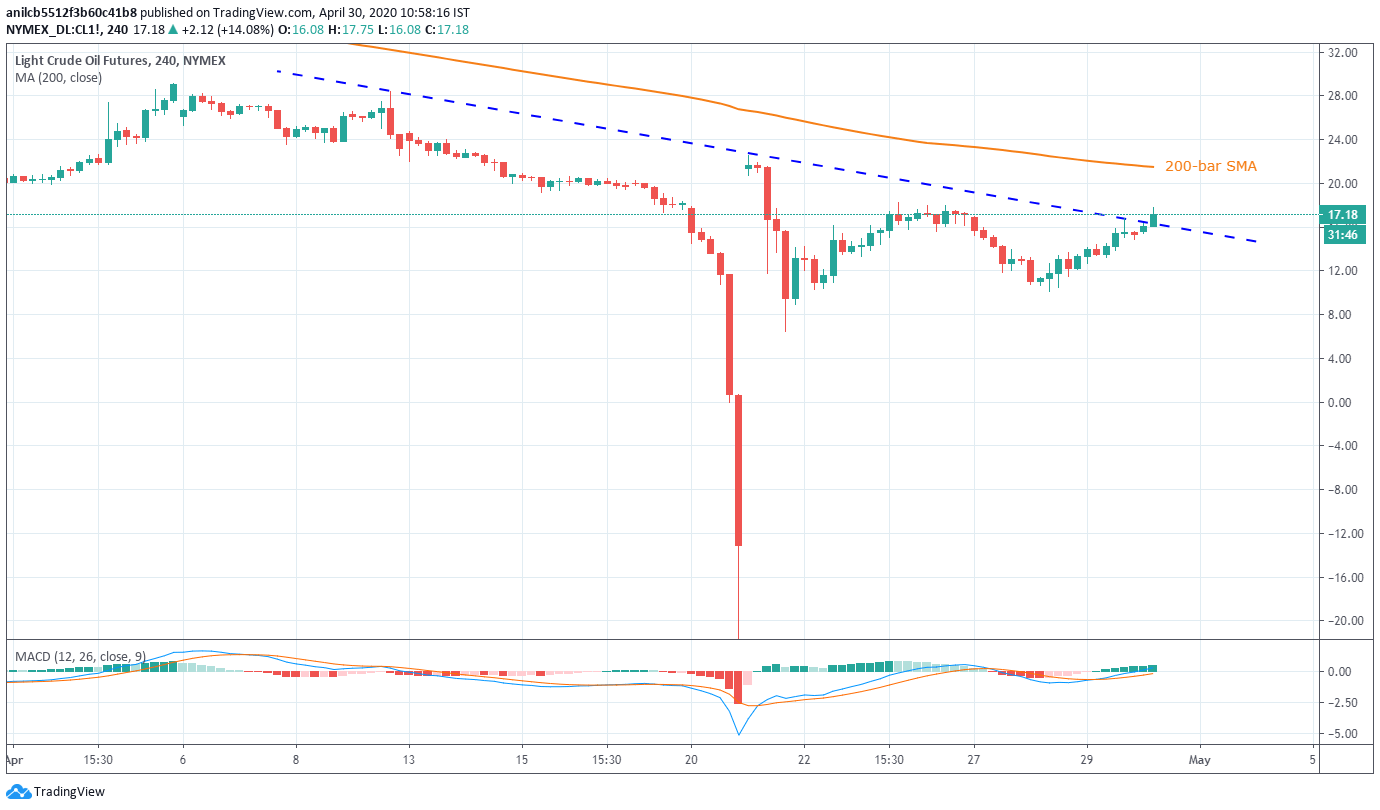
Trend: Bullish
