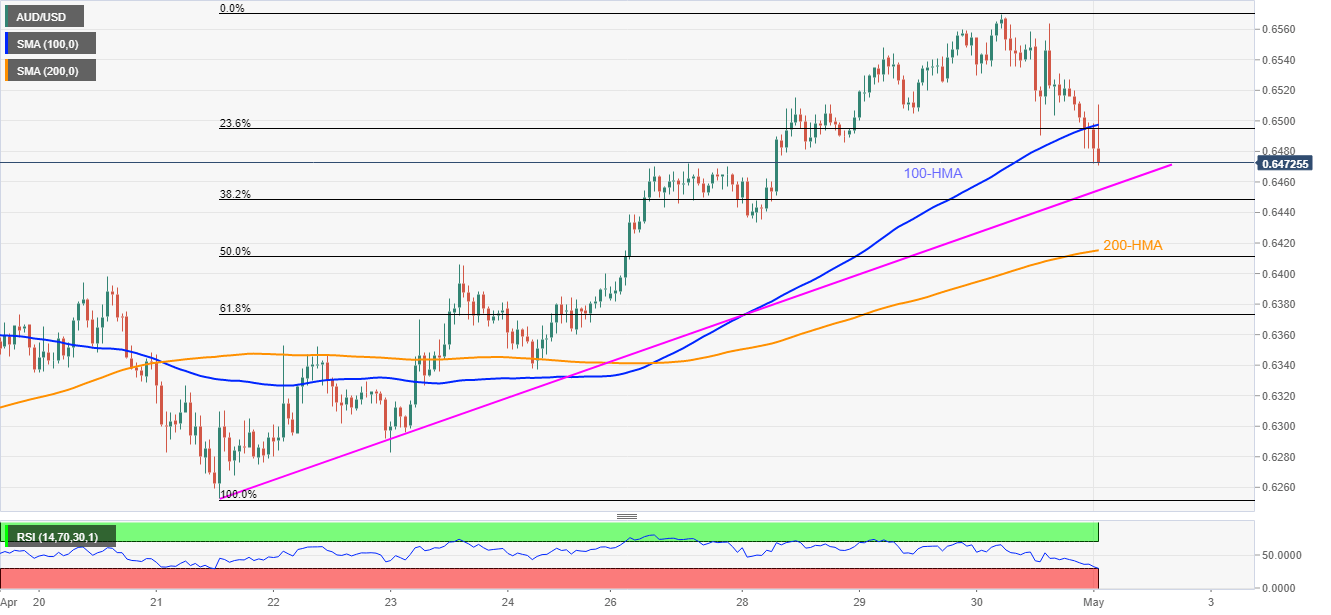
- AUD/USD extends Thursday’s pullback moves below 100-HMA.
- An eight-day-old ascending trend line, 200-HMA on the sellers’ radars.
- 100-day SMA seems to cap the pair’s near-term upside.
AUD/USD bears gain extra momentum on the downside break of 100-HMA as the pair drops to 0.6475, flashing 0.50% loss on a day, amid the initial trading session on Friday.
With the sustained break below near-term key HMA, the pair is likely extending its latest declines towards an ascending trend line from April 21, currently near 0.6455.
However, 200-HMA figures of 0.6415 and oversold RSI conditions seem to question the Aussie pair’s further downside.
On the upside, 0.6500, 0.6530 and 100-day SMA level of 0.6565 are likely immediate resistances for the pair traders to watch during the pullback moves.
If at all the quote manages to cross 0.6565 level on a daily closing basis, March month high near 0.6690 will return to the chart.
AUD/USD hourly chart
Trend: Further downside expected
