- GBP/USD pulls back from the 12-day top.
- 61.8% Fibonacci retracement acts as immediate support.
- February month low adds to the resistance.
Having registered another failure to cross 200-day SMA on Thursday, GBP/USD drops to 1.2567, down 0.20% on a day, during Friday’s Asian session.
The pair currently seems to decline towards 61.8% Fibonacci retracement of March month declines, near 1.2515, ahead of revisiting 1.2500 round-figure.
It should, however, be noted that 50-day SMA near 1.2440 could question the pair’s downside past-1.2500.
Meanwhile, a daily closing beyond a 200-day SMA level of 1.2655 enables the bulls to aim for February month low surrounding 1.2725.
Additionally, the pair’s sustained run-up beyond 1.2725 may take a halt around 1.2800 and 1.2930 before challenging the 1.3000 psychological magnet.
GBP/USD daily chart
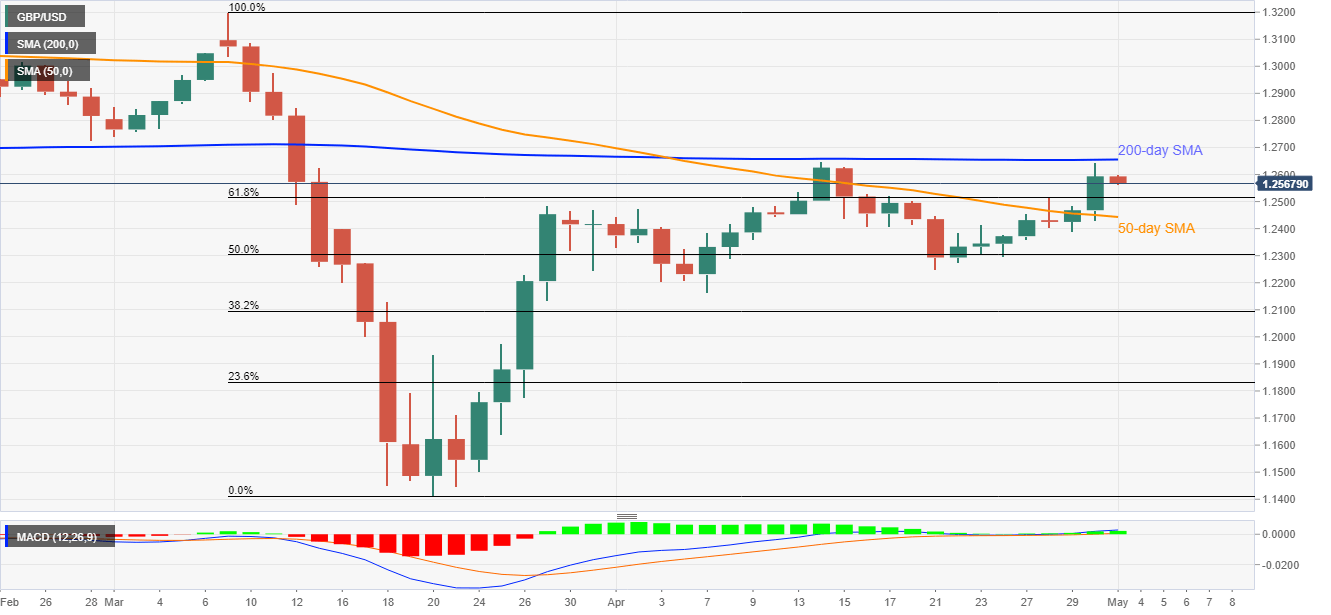
Trend: Pullback expected
