- WTI is losing ground in Asia with intraday charts reporting bearish conditions.
- A former resistance-turned-support near $18.50 may come into play.
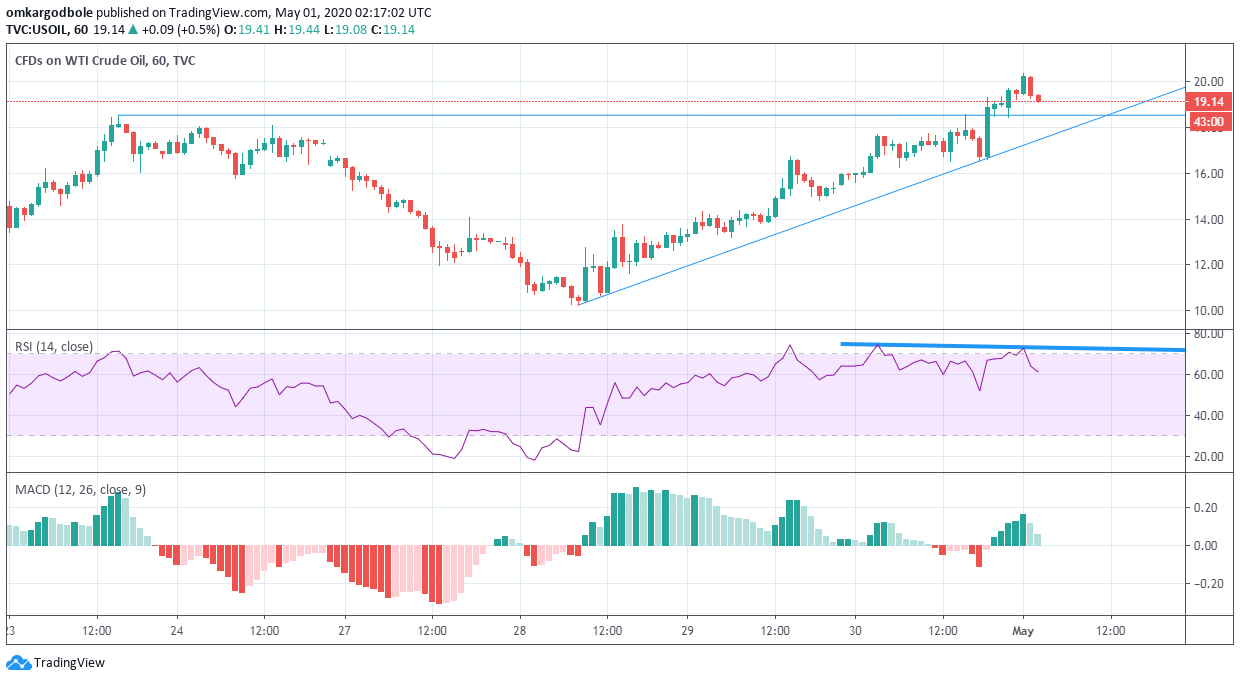
West Texas Intermediate may extend losses to former hurdle-turned-support, as the hourly chart is reporting a bearish indicator divergence.
At press time, a barrel of black gold is changing hands at $19.25, having hit a high of $20.39 early Friday.
The pullback looks set to continue toward the horizontal support at $18.52, as the hourly chart relative strength index has produced a bearish divergence, which occurs when an indicator charts lower highs, contradicting higher highs on price. The divergence indicates a weakening of upward momentum and often yields notable declines.
The hourly chart MACD is also producing lower bars above the zero line, also a sign of bull fatigue.
Acceptance under $18.52 would expose the ascending trendline support, currently at $17.50. Alternatively, a bounce from $18.52, if followed by a quick move above $20, would negate the bearish divergence and open the doors for stronger gains.
Hourly chart
Trend: Pullback
Technical levels
